This rather lengthy handout (>11,000 words) is meant to accompany the Praat workshop I am giving to the Voice and Speech Teachers Association (VASTA) on July 25, 2026. The goal for this workshop is to introduce the fundamentals of Praat for voice and speech professionals who have little or no prior experience with the software. In this handout, I’ll cover how the acoustic correlates of elements of speech like pitch, vowel quality, and voice quality are represented visually. I hope that you’ll be able to walk away with some practical skills for exploring and understanding speech.
1 The basics
Praat (Dutch for “talk”) is a free computer software package for the scientific analysis of speech and phonetics. Written and maintained by Paul Boersma and David Weenick, Praat has tons of features and can do a very wide range of functions for processing speech. Recently, Anastasia Shchupak has joined as co-author and is involved in AI tools like transcription. Of the many things that Praat can do, I can only show a small portion of them. Hopefully I’ve selected a set of features that’ll be useful for you.
I’ll be the first to say that Praat definitely has some negative aspects:
Praat is not the most visually appealing program. The icon, which is supposed to look like an ear and lips, probably hasn’t changed since the 90’s when the software was first created.
It is also not the most intuitive software. Everything is hidden behind menus and buttons and everything takes a lot of clicks.
It’s not the easiest software to learn how to use. The documentation online can be brief and never seems to has enough detail. There are no books on how to use Praat. There are tutorials but they’re scattered and often are aimed at performing specific tasks. There is help within the software itself, but it’s not easy to use.
In the past, Praat has been unstable. It would often crash without warning, meaning you’d lose all your work. There is no autosave feature. Recent versions seem more stable, but there’s always a small chance of it crashing.
With that said, Praat is still a highly sophisticated piece of software under-the-hood. There are some definite pros for using Praat:
It’s the standard. Nearly every linguist has used Praat at some point. People in allied fields who study speech likely hav as well.
While the software itself may not be pretty, the visualizations it can produce are professional quality.
It actually has its own scripting language, to help automate any function it can do. This is especially useful if you have a task that you need to do over and over. Unfortunately, I can’t show how to script here, but there are tutorials online, including my own. See Section 9 for links to those.
It’s free.
The pros outweigh the cons for sure.
1.1 Download and installation
Praat is available at praat.org and can run on a variety of operating systems. To install it, simply go to praat.org and at the upper left of the site, click on your computer’s operating system. The program is relatively small and simple to run. To open Praat, click on its icon like any other program on your computer.
Make sure you have Praat installed before moving ahead!
1.2 The Praat interface
When you first open Praat, there will be two windows that appear. One will have a pink rectangle and is where visualizations will occur. We’ll us that later, but for now, we don’t need to worry about it, and you can just close it.
The other window is your home base for Praat (Figure 1). It’s called the object window and is where your Praat objects will appear. Praat objects can be of many different types, such as Sound, TextGrid, or Spectrum (we’ll get to these later). Strictly speaking these are contained in your computer’s memory and are not automatically saved. This means that if Praat crashes, everything in your object window is lost. So save often!
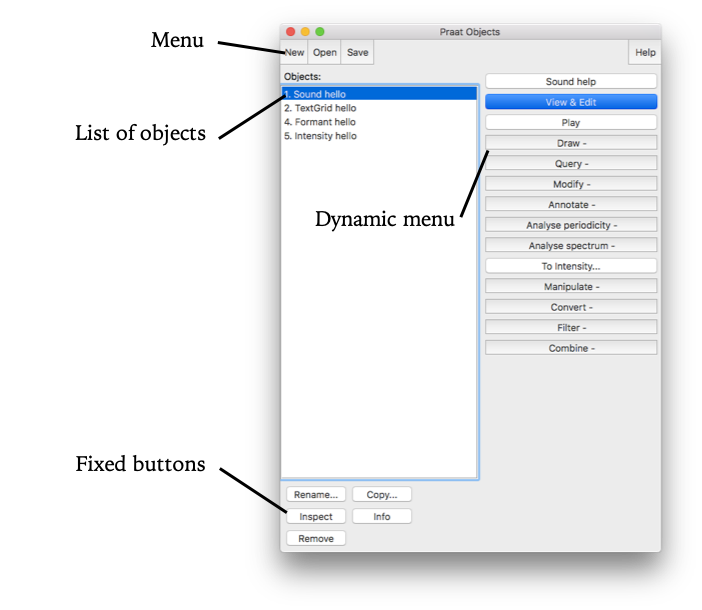
The menu is relatively straightforward. I say that because while the basic functions are clear, I am not familiar with most of the options in each of these menus. Here are what each of the menu items do and the ones I use:
New: This is where you can create new objects from scratch, such as recording a mono or stereo sound. I have never needed to use any of the other options and submenus in this menu.Open: This is where you can load files already stored on your computer, such as a recording downloaded from the internet or some other Praat-specific file you’ve created in the past. While Praat can handle pretty long sound files, but they take up a lot of memory. So if you’re working with a sound file longer than a couple minutes, it might be better to open it as a LongSound file.Save: This menu allows you to save files in one of many formats, depending on the kind of Praat object. I almost always save audio as a WAV file and everything else as a text file.
As you can see, there are many other options, just in creating, loading, and saving files, but these basic options will serve you just fine.
Moving down the objects window, next is the list of objects. This is where you can see the names of the Praat objects currently in memory. As mentioned previously, these objects can take several forms, and Figure 1 above showed just four of them: Sound, TextGrid, Formant, and Intensity. For each object, the objects window displays what kind of object it is, followed by its name. In this case, object number 1 is a “Sound” object that is named “hello”.
At the bottom of the objects window you will find the fixed buttons. These are “fixed” because they are always there and available, regardless of what is in the list of objects. The utility of the Rename, Copy, and Remove buttons is self-explanatory, and the Inspect and Info buttons show various properties and information about the selected objects.
Finally, on the right side of the window we see the dynamic menu. This side will display buttons for many functions available to whatever Praat object(s) is/are selected. Some things can be performed on Sound files, other are only done on TextGrids. We’ll get into what these functions do later.
2 Working with Sound
Now that we’ve got some preliminaries out of the way, the first main portion of this workshop will be to work with audio in Praat. We’ll move on to transcriptions (using Praat TextGrids) in Section 3.
2.1 Making a recording
Let’s make a recording directly in Praat. You will more likely be loading in your own audio when you use Praat for real-life applications, but it’s good to see how it’s done. Open the SoundRecorder window by following this command:
New > Record mono Sound... Here you’ll see the basic window for recording sound directly into Praat (Figure 2). Depending on your operating system, you may see different options, but the general layout is the same. You can change it to a stereo sound if you have a stereo microphone, but I always use mono to save on disk space. If you have an external microphone plugged in, you can use that for recording. Otherwise, you can use the one that’s built into your computer. On the right, you can set your sampling frequency. For most speech, it’s sufficient to set it at 44,100 Hz, but if you want to set it higher (I guess if you’re recording bats??) you can set it to much higher. The smaller sampling frequency will result in a smaller file size.
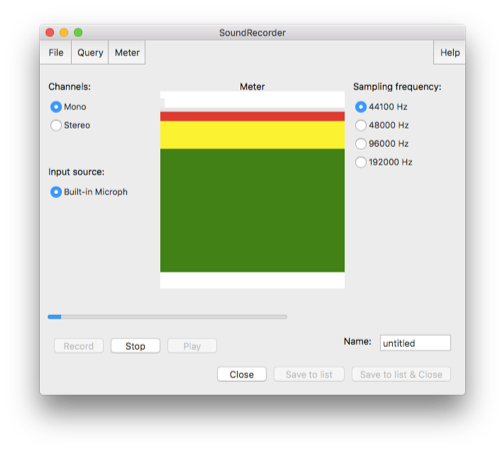
When you hit the Record button, it’ll display a visual cue of how loud it is in the main center box. You want to stay within the green: if it’s too soft you can always amplify the sound later. Anything in the red means the sound has been clipped which can’t be fixed. When you are done, hit Stop. At this point, be careful because it’s easy to lose the recording. For example, if you hit Record again, you’ll lose it all and you can’t get it back. Right now, it’s a good idea to save the file (see below).
Go ahead and record yourself saying something. Here is a sentence you can try if you can’t come up with anything short.
“She tried to make herself sound younger than she was, the way adults did when talking to little babies.”
A couple things to know about recording in Praat. First, Praat has a recording buffer. By default, it’s 20 megabytes, meaning it’ll cut you off once the recording takes up that much memory. Audio recorded in stereo or with larger sampling frequencies will eat up more of this memory quicker. You can change this cap by going to Praat > Preferences > Sound recording preferences... and setting it to a larger buffer. I don’t do very much recording in Praat (I mostly use another free software called Audacity if I need to record from my computer directly), but it’s nice to know how to in case you need it for smaller things. Also, for those who want to know, Praat records with a 16-bit audio depth, which is about the quality of an audio CD.
When you’re ready, go ahead and give your recording a name, and save it to the objects window (Save to list) and close the SoundRecorder window. Or, you can do this all in one step with Save to list & Close.
2.2 Saving a recording
Any audio file you have in Praat can be saved. In fact, as mentioned above, you should save often since Praat doesn’t have any sort of auto-save feature. To save an audio file, go to File > Save as WAV file…. From there, you can navigate to a place on your computer where you want to save the file. Praat sometimes doesn’t automatically add file extensions (in this case, the .wav at the end of the filename), so you’ll want to make sure it’s there and type it in yourself if it’s now.
You may know this already, but WAV files are among the best kind to work with when dealing with audio. Some filetypes like mp3s compress the audio by removing information that it things humans won’t notice. When working with Praat, we want the full uncompressed audio. Making sure you deal only with WAV files if you can is the way to go.
2.3 Opening an existing file
If you would like to open an audio file that already exists in your computer, you can do so by going to Open > Read from file… in the objects window. Notice that Praat has another option, Open > Open Long Sound file….
As mentioned above, this is useful for when you want to load in, as you might guess, a long sound file. I don’t know if there’s a clear definition of what a “long” sound file is, and it probably depends on your computer. But generally for me, if I’m working with something that’s more than a few minutes long, I’ll open it as a Long Sound file. The difference between them is what Praat stores into your computer’s short term memory. For a regular Sound file (opened using Read from file), Praat will store the entire thing into your computer’s memory. That can eat up a lot of processing power if it’s a big file. Opening a Long Sound means Praat will only load in what it needs at a time, rather than the whole thing. If you load a Sound file and you notice Praat being a big laggy, try Removeing the file and reloading it as a Long Sound file.
You’ll get the most out of this workshop if you have an audio file to work with. Pause here and make sure you have sound. If you do not have access to a microphone right now but would like to follow along still, you may download some sample recordings from some interviews I’ve done here.
2.4 Sound objects
Now that you have a Sound file open and selected in Praat, you’ll see lots of options of things you can do in the dynamic menu (Figure 3).
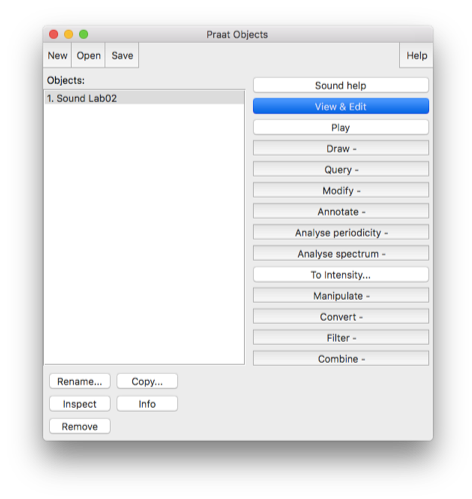
Let’s look at the different options in the dynamic menu.
Sound help: Here, you can see all sorts of help pages relating to Sound files.View & Edit: This opens up the SoundEditor window. We’ll get to that below.Play: Click this and the sound will play. Don’t click this if your file is longer than a few seconds!Draw: This is where you produce and export visuals.Query: This menu button has lot of submenus that let you extract information from your audio such as how long it is, the time where the sound it at its loudest, and lots of other information.Modify: Here is where you can make global changes to the audio: make it louder, turn it backwards, override the sampling frequency, etc.Annotate: This menu allows you to create aTextGrid, which allows annotation of theSoundfile. We’ll get to that later in this workshop.Analyse periodicity: This allows you to extract things like the pitch or signal-to-noise ratio from the audio and analyze them separately.Analyse spectrum: Among other options, this menu allows you to extract and analyze just the formant values in the audio, which is useful for studying vowels.To Intensity…: This extracts just the intensity (=loudness) of the audio and lets you get information from it.Manipulate: This lets you modify parts of audio like the intonation or vowel formants to create a synthesized modification of the audio.Convert: Here is where you can convert stereo to mono, extract portions of the sound, or do pitch alternation.Filter: This menu allows for filtering out low or high sounds. For very noisy recordings or audio that was recorded on bad equipment, this might help the clarity.Combine: If you have multiple recordings you want to either overlay on top of each other or concatenate them, you do that here.
As you can see, there are a lot of options for Sound files. After all, Praat is primarily a tool for analyzing audio. In this workshop, we will use some of these tools, but the majority serve very specific purposes that we don’t have time to get into today. There are some tutorials on some of these online, though they are often geared towards advanced linguistics students. See Section 9.
2.5 The SoundEditor window
For now, let’s see how Praat visualizes the sound. After highlighting the Sound file, click View & Edit to open the SoundEditor window. Figure 4 shows the main components of this new window. Taking up the majority of the space are two visualizations: the waveform and the spectrogram. For both of these, the x-axis, represents time. So the beginning of the audio is at the far left and the end is at the far right.
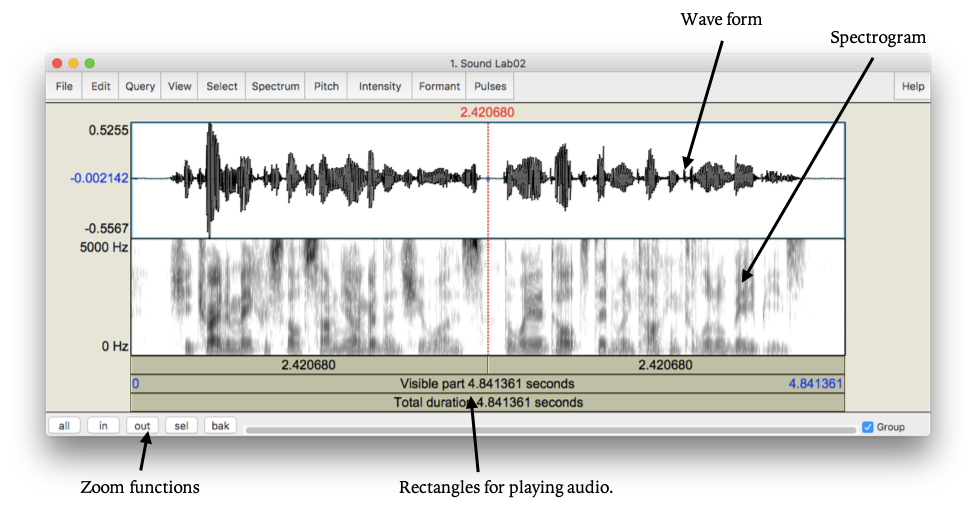
The waveform is a visual representation of the actual sound wave. When the black portion of the waveform is taller, it’s louder, while smaller ones are quieter. In fact, if you zoom far enough in, you can see that the black shapes become just a single line moving up and down, which represents the sound wave. On the left of the wave form, the numbers at the top and bottom of the y-axis of the wave form (0.5255 and -0.5567) represent the signal-to-noise ratio (SNR), which ranges from 0 to 1. The blueish number is the SNR measurement at the point where the cursor is. Higher numbers usually indicate cleaner audio, unless it’s a 1 in which case almost certainly means the audio was clipped.
Parallel to and below the waveform is the spectrogram, which is a different way of viewing sound. The spectrogram breaks down the speech signal into its component frequencies using what’s called a Fourier transformation. All you need to know for now is that the top represents higher frequencies while the bottom is lower frequencies. A trained phonetician can actually “read” a spectrogram and know what is being said. If you click on the spectrogram, a red number appears to the left showing the frequency in Hertz (Hz) at that point.
To play portions of the audio, use the rectangles below the spectrogram. In addition to providing information about the duration of each one, if you click on them they’ll play that portion. To start playing somewhere in the middle, just click on the wave form or the spectrogram where you want to start and the rectangles will update. To select a smaller portion of the audio to play, just click and drag and highlight a section. You can always press tab to start or stop playing the currently selected region as well.
To change the view, you can zoom in and out with the zoom buttons at the bottom left. You can zoom out to see the whole file (all), or just zoom in (in) or out (out). If you highlight a section of audio, you can zoom to just that selection (sel). You can also go back to your previous view (bak). If you have lateral scrolling on your computer, after you zoom in you can move side to side with that.
At the bottom right is the Group checkbox. If you have multiple SoundEditor windows with the same audio in them (for example, with different TextGrid files), if this box is checked, when you scroll, all windows will scroll in tandem. If you want them to scroll independently, uncheck this box.
Across the top of the SoundEditor window, there are even more menu options, some of which overlap with the dynamic menu options for Sound files we saw earlier:
File: Here you can save the audio to your computer, extract portions of it, or save the visualizations.Edit: Here you can copy and paste portions of audio.Query: This lets you extract information such as the exact time the curser is at.View: This has more specific zoom and playing options.Select: This lets you move the cursor to specific times.Spectrum: Here you can change some of the settings for how the spectrogram is displayed.Pitch: This helps you analyze the pitch of the audio, which is very helpful for those studying intonation and tone. You can display the pitch overlaid on the spectrogram, find the minimum and maximum pitch in a selection, and extract just the pitch contour for visualizations.Intensity: Similar to pitch, this includes options to overlay the intensity contour as well as options for extracting that informationFormant: This is another similar menu item, which displays formant measurements and options for extracting them. This is very handy for studying vowels.Pulses: If you want to study creaky voice, this menu has options for displaying and extracting information about pulses in the vocal folds.
We’ll spend most of the rest of the time in this workshop in this SoundEditor window, once we add a transcription to it.
3 Working with transcriptions
Unless you’re really good at reading a spectrogram, you’ll likely want a transcription to accompany your Sound file. In the short term, this makes it a lot easier to figure out where you are in the file, especially for long files. But down the road you might find it helpful for other reasons too. Let’s see how Praat works with transcriptions.
3.1 TextGrid Objects
Transcriptions in Praat are accomplished using TextGrids. Before explaining the underlying mechanics of how these work, it might make more sense just to see one. Take a look at Figure 5.
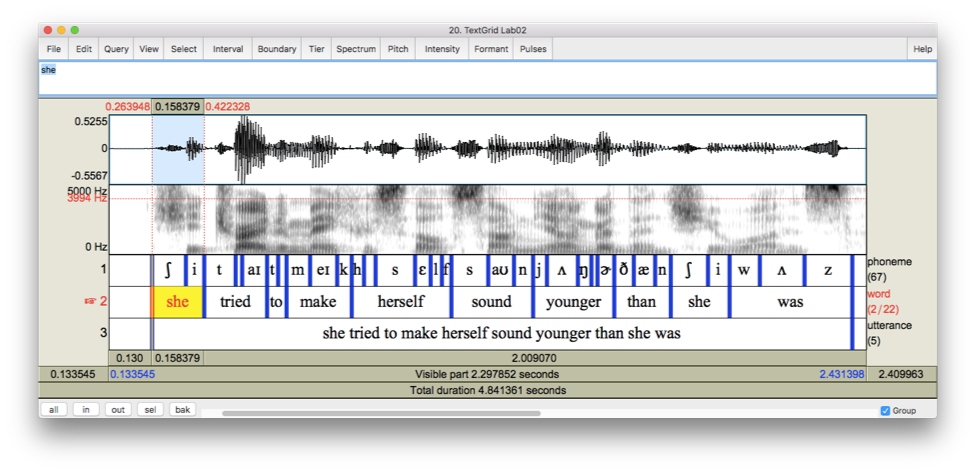
When we view both the Sound file with its TextGrid, we can see how they line up. The waveform and the spectrogram are displayed like before, only underneath those now we have various tiers of text. In this example above, I have three tiers: “phoneme,” “word,” and “utterance”, the last being a catch-all for “sentence” or “breath group”. Each tier can have any number of boundaries, which are represented by the blue vertical lines. These boundaries delimit the intervals in the tier. It is in these intervals that you can type transcription, annotations, or whatever other text you want.
When you click on an interval, it turns yellow with red background. The accompanying portion of the audio is also highlighted. Finally, the text is displayed in the text editor above the wave form but below the menu items. It is here that you can edit the text. Note that since this is a speech analysis software, it is perfectly capable of working with foreign and unusual characters, as you can see with the IPA characters in the first tier.
Many of the commands that were seen for sound files can also be found here as you view both a Sound and a TextGrid object at the same time. You can play, zoom, and highlight portions of the audio and TextGrid. There are a few new commands in the menu:
Interval: This menu allows you to add new intervals to theTextGridfile. These commands come with keyboard shortcuts, so it’s usually easier to use those instead.Boundary: Very similar to the Interval menu, this allows you to add individual boundaries to whatever tier you want.Tier: This lets you add, duplicate, rename, or remove tiers from theTextGrid.
It is usually easier to view TextGrids and Sound files at the same time.
3.2 Creating a TextGrid
So, let’s make a TextGrid. To create a new TextGrid that accompanies a Sound file, highlight the Sound file in the Praat Objects window (you may need to close the View & Edit window to see the Praat Objects window) and click on Annotate > To TextGrid….
In the Sound: To TextGrid window, there are two boxes for input. In All tier names: delete the default text (“Mary John bell”) and type “phoneme word sentence”. This will create three tiers, one called “phoneme,” one called “word,” and one called “sentence.” Where it says Which of these are point tiers?, make sure that’s blank. (That’s used for in-depth analysis of intonation, which we won’t cover in this workshop.) Hit OK and you should see your new TextGrid object in your Praat Objects window. Highlight both the Sound and the TextGrid objects and then click View & Edit to open the TextGrid editor like we saw above.
3.3 Working with TextGrids
Adding intervals and boundaries: When you open a brand new TextGrid, there will not be anything in any of the tiers. To add boundaries, click somewhere in the audio and go to Interval > Add interval on tier 1. I’d recommend learning the keyboard shortcut: Ctrl/Command + 1. You’ll now see a blue vertical bar on the top tier aligned with the point in the audio you clicked. Go ahead and add an interval on tier 2 and tier 3 as well.
Deleting boundaries: To delete a boundary, click on it—it will appear as red and yellow if it is selected—and go to Boundary > Remove. Or you can follow the keyboard shortcut: Alt + Backspace.
Moving boundaries: To move a boundary, simply click on it and drag from left to right. If you have boundaries on multiple tiers that are aligned, you can move them together by holding Shift while dragging.
Playing intervals: Once you have several boundaries, the space between them (the intervals) will contain portions of audio. You can play just that portion of audio by clicking the interval and hitting the Tab key. Alternatively, you can click the rectangle below the corresponding portion of the audio and play it as well.
Saving TextGrids: Be sure to save often! All the work you do in Praat is not saved automatically. Even when you’re done, you must explicitly save your TextGrid or else your work will be lost. To save a TextGrid, close the Sound Editor window, highlight the TextGrid in the Praat Objects window, and go to Save > Save as text file…. Add .TextGrid to the filename if Praat doesn’t do that for you to ensure that it gets saved properly and so that Praat knows how to open it afterwards.
In the following four sections, I’ll demonstrate some of the specific things you can do with Praat. As I do so, I’ll keep certain questions in mind that you may have about your audio. I’ll start by seeing how you can work with pitch, in case you have questions about or want to visualize intonation. I’ll then move on to glottal pulses, which is good if you want to analyze creaky voice or other voice qualities. I’ll then talk about formants, which can be helpful when looking at vowels. We’ll then look at plosive consonants by examining voice onset time (VOT). We’ll end with looking at sibilant consonants by examining center of gravity. In each section, I’ll present some of the basic Praat functionality including how to extract certain acoustic measurements. We’ll briefly see how to visualize each one. I’ll also discuss a little bit about the phonetics of each phenomena that might aid your interpretation of what you’re seeing.
4 Pitch
First, we’ll examine the pitch of speaker’s voice. This is useful if you want to look at intonation or tone (depending on the language). Unfortunately, intonation is notoriously difficult to study and pin down, so I really won’t be able to show much more than simple visualizations and measurements.
4.1 Visualizing pitch
Praat can approximate pitch by estimating how often the speaker’s vocal folds are vibrating at any point during your recording. To view these estimates, open a Sound file, either by itself or together with a TextGrid. I’ll use this recording of myself:
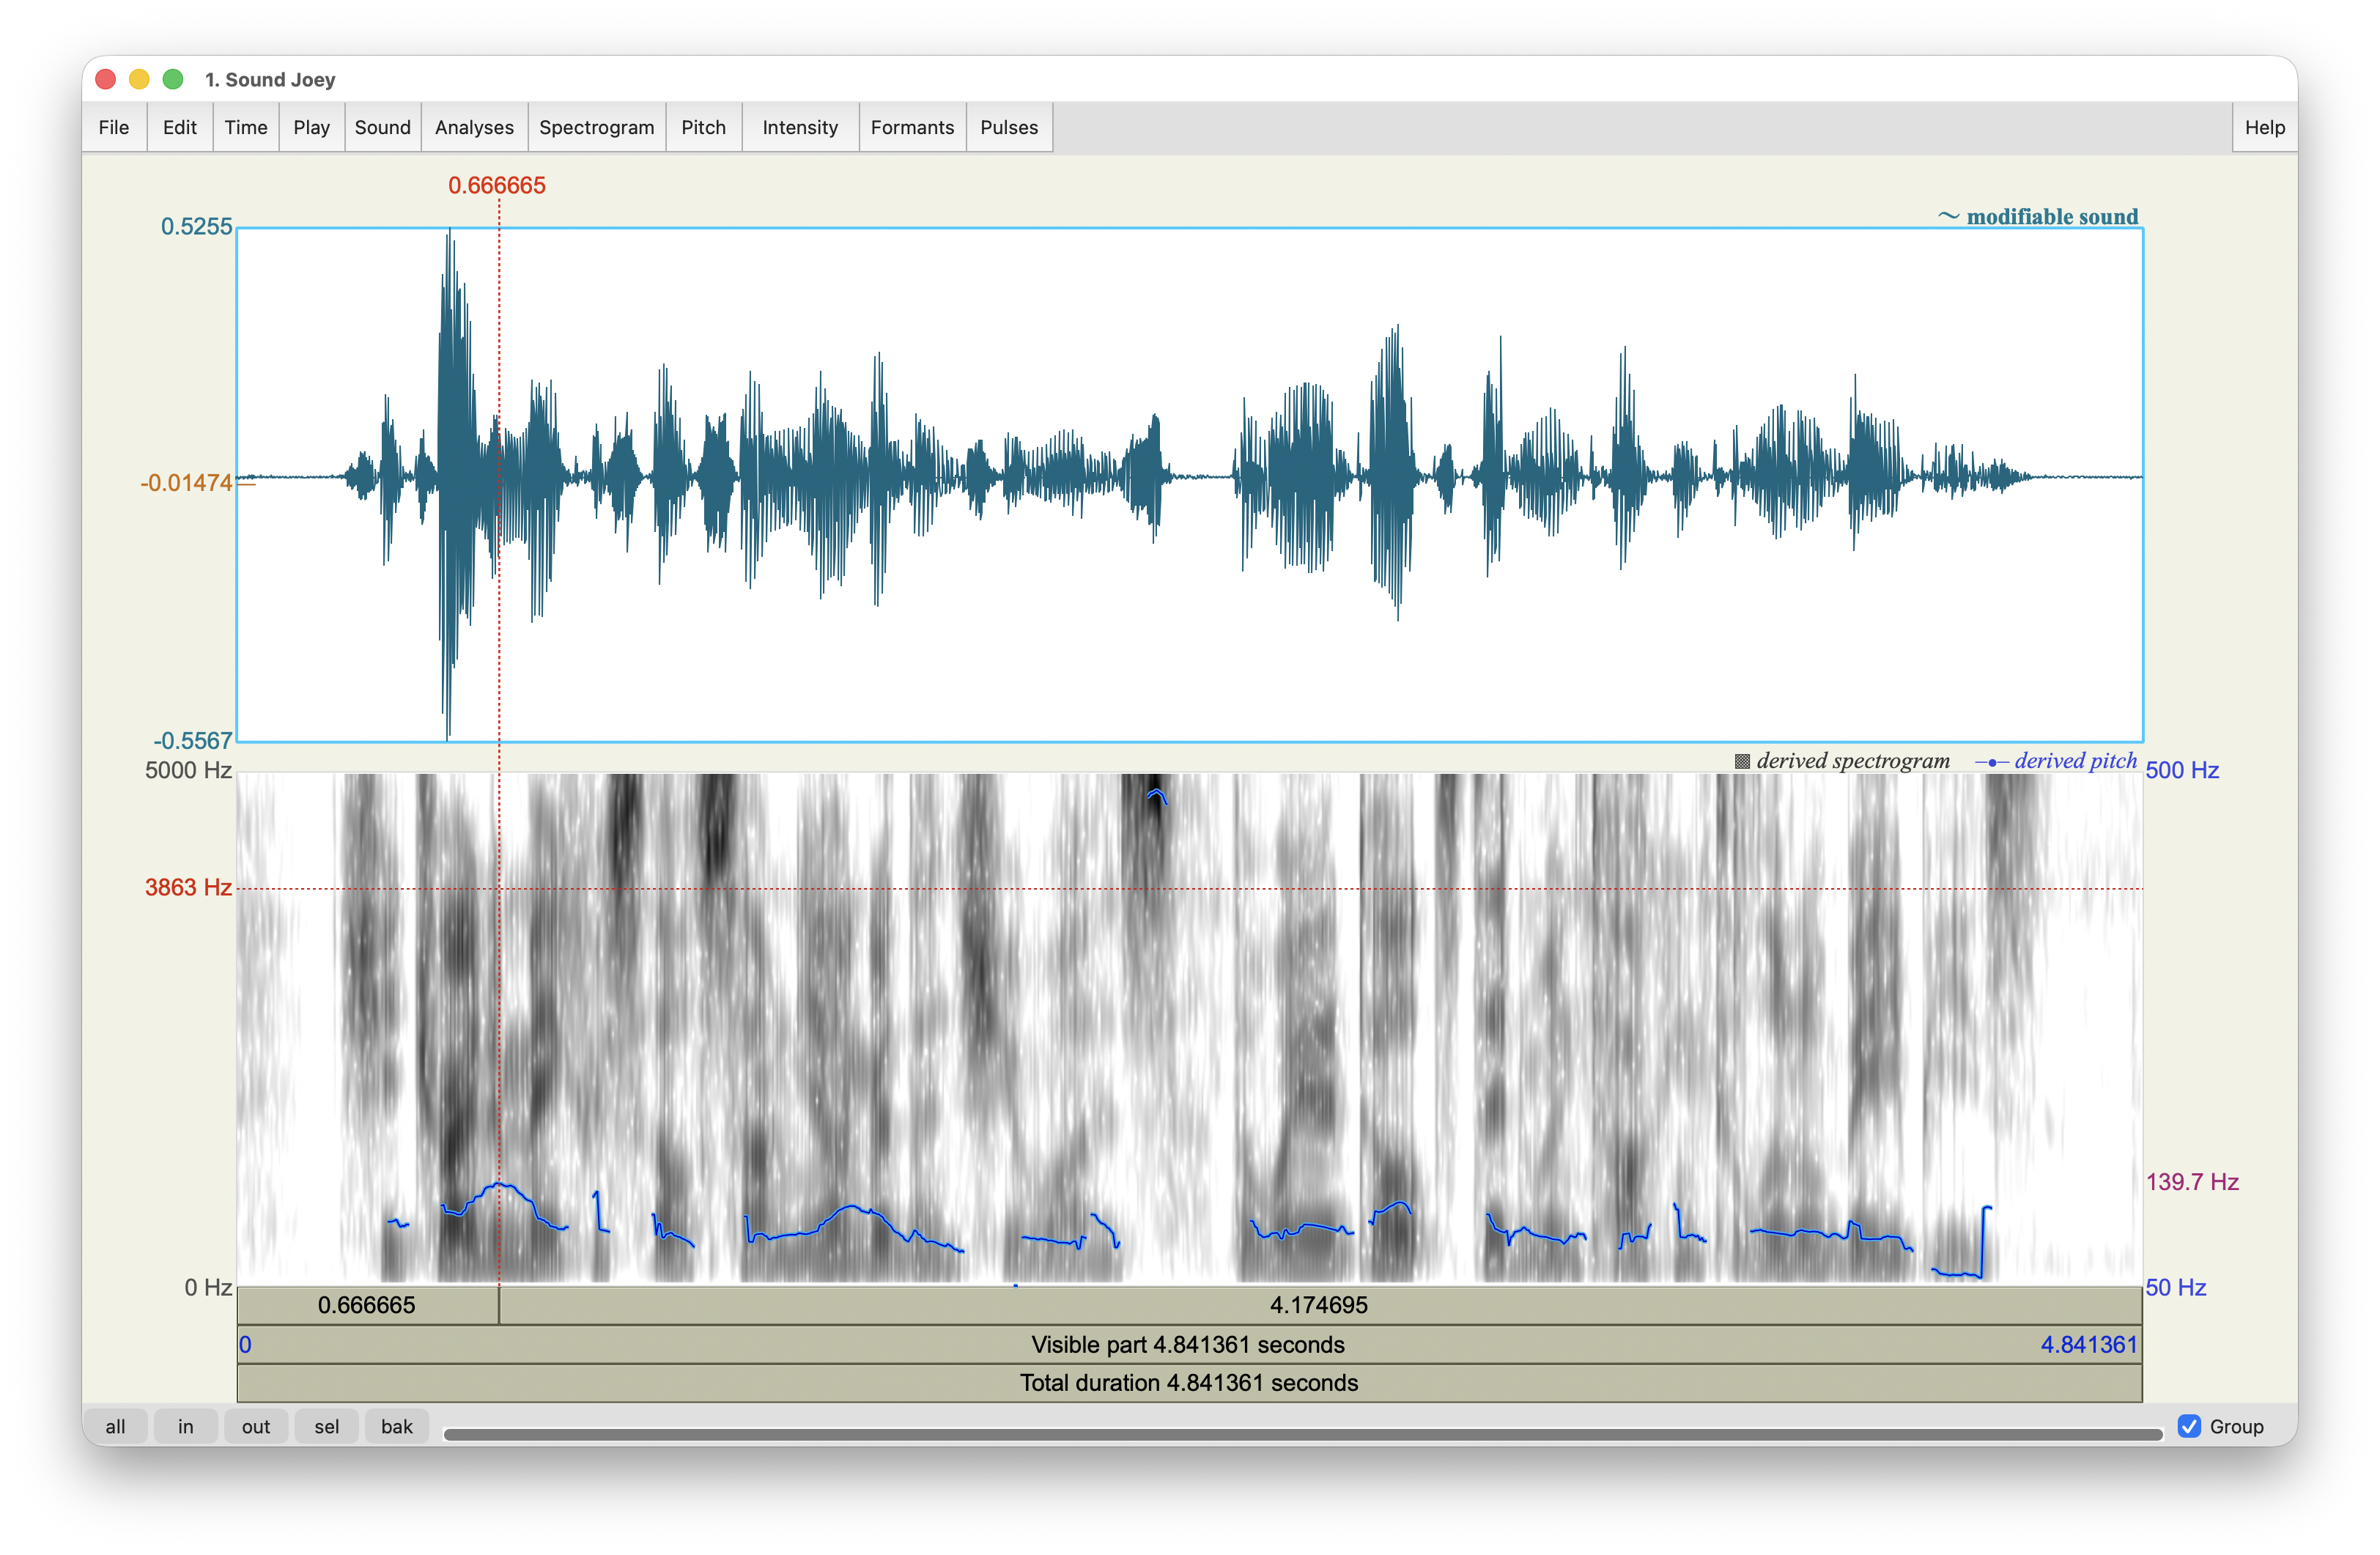
Once you’ve got that loaded into Praat, turn on the pitch visualizer by going to Pitch > Show pitch. This will overlay a blue line on the spectrogram showing the pitch at that time point. It’ll also add a secondary legend to the right side of the spectrogram showing an approximate range of pitch values in the visible portion of the audio. See Figure 6.
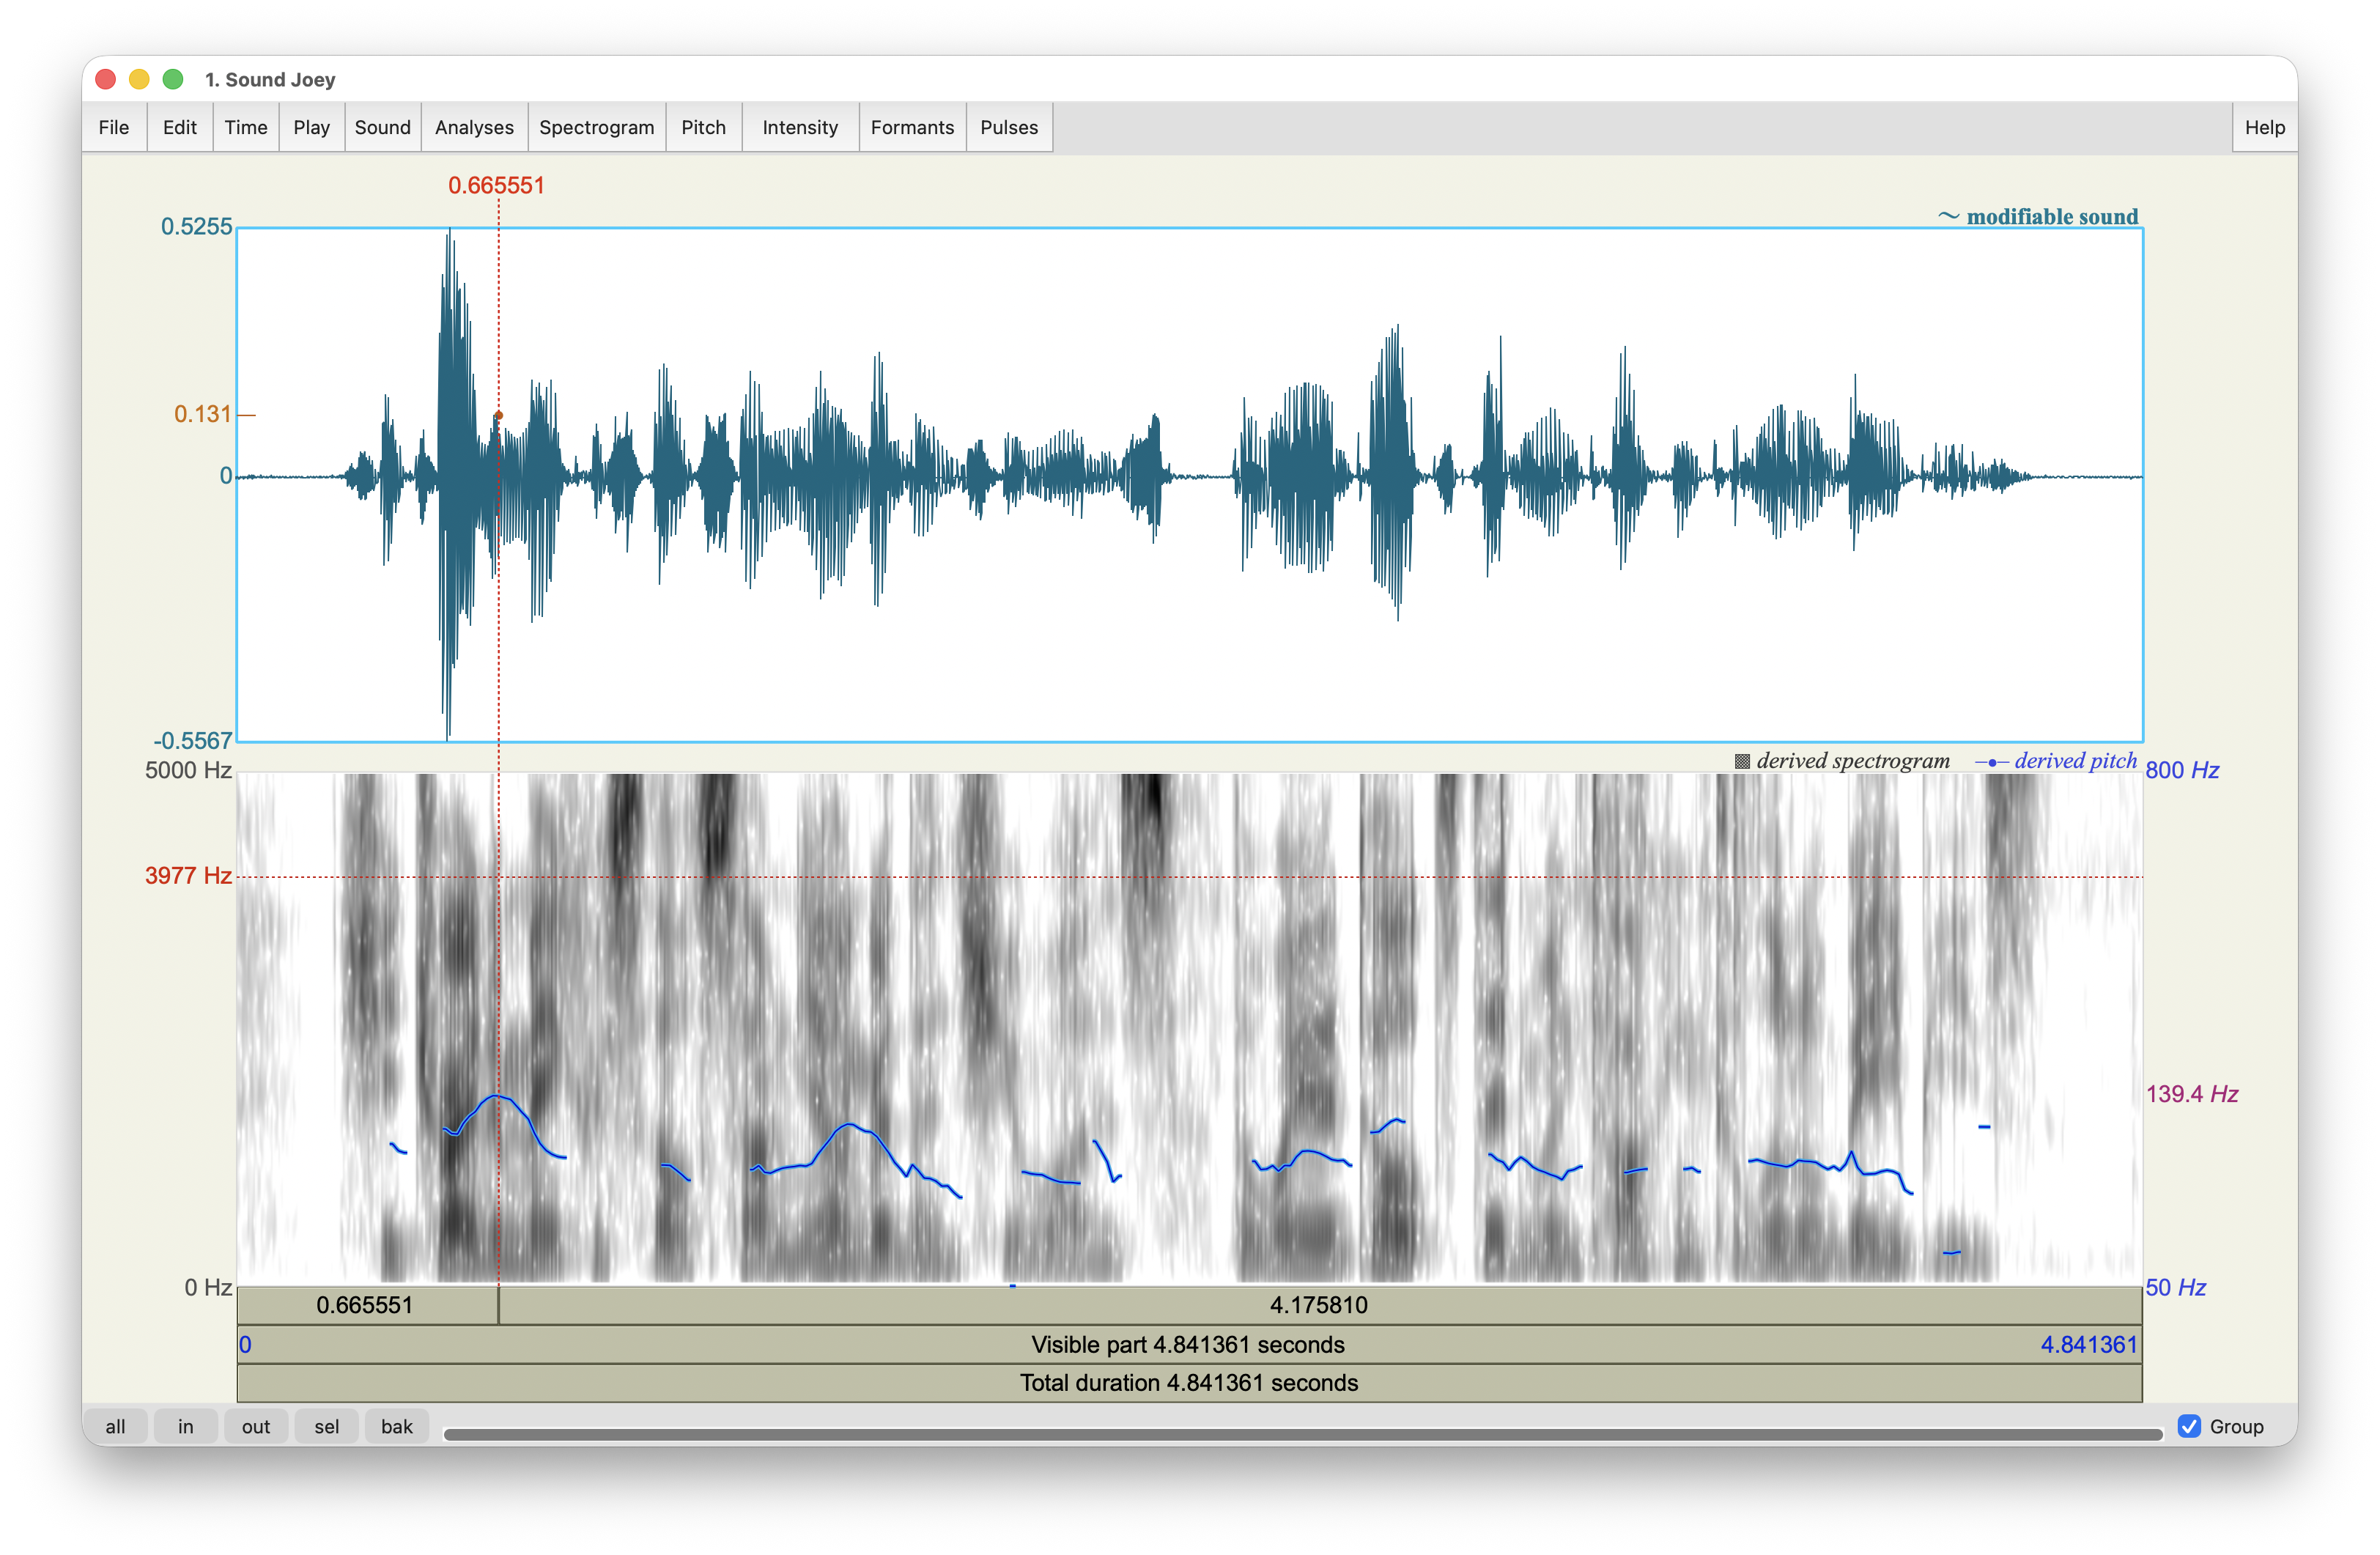
In this sample of my voice, the pitch is somewhere between 80 and 140 Hz. It’s a little hard to see the contour though because the pitch range is relatively narrow compared to the full visible range of 50–800Hz that it can show. Let’s adjust the Pitch settings a little bit by zooming in a little bit on that range. Go to Pitch > Pitch settings (filtered autocorrelation)…. A new window will pop up with a whole bunch of options. We don’t need to worry about all of them. The one we want to adjust are the first two: the Pitch floor and top. You should see 50.0 and 800.0. Since we know the pitch range in the recording is only between about 80 and 140 Hz, let’s zoom in to closer to that range. I’ll try from 70 to 160Hz. Here’s what that should look like now (Figure 7).
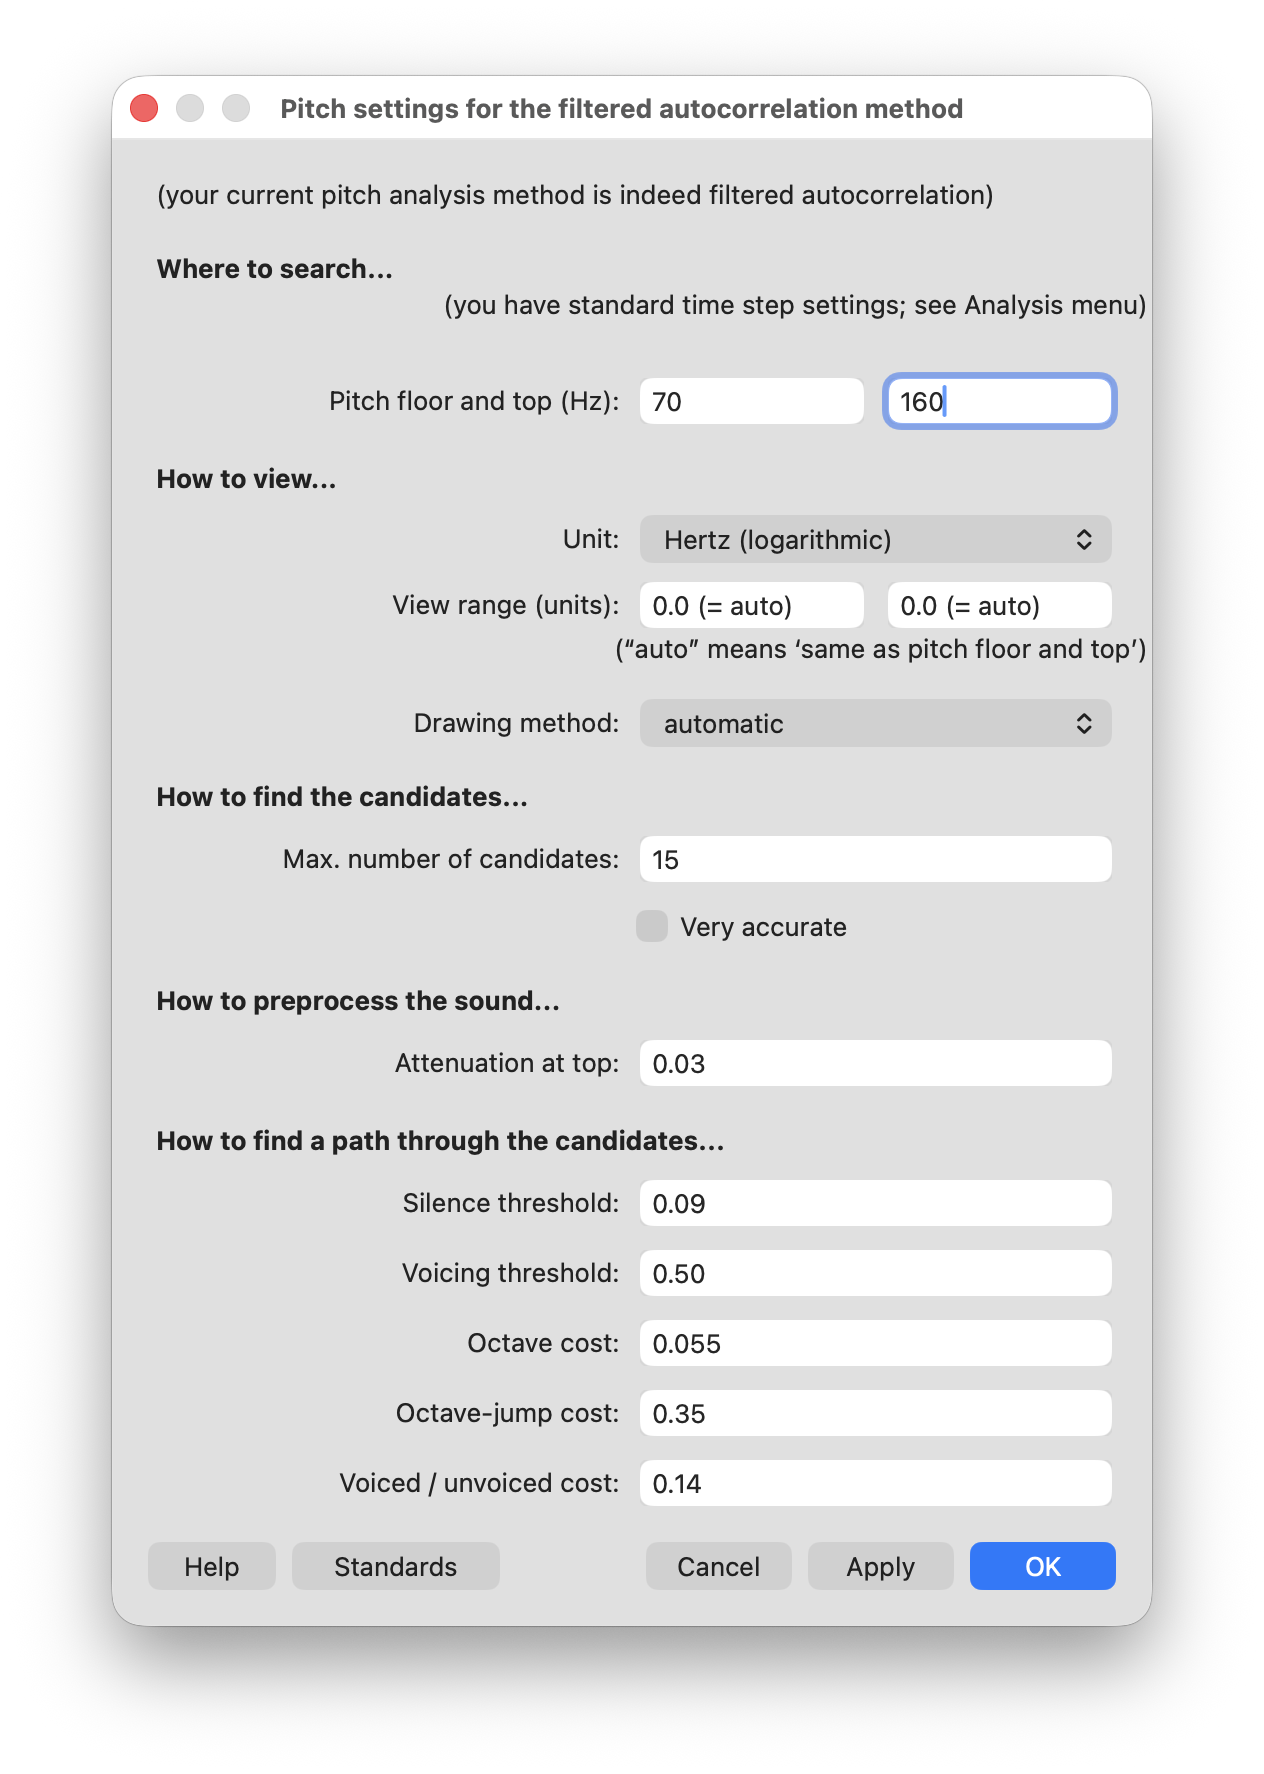
That’s the only change we need to make to this window. If you can see this window and your spectrogram at the same time, try clicking on Apply as you watch the blue line. (In Praat, Apply changes the settings and keeps the window open while OK changes the settings and closes the window.) You should notice the blue line is now more spread out vertically since we’ve zoomed into that range (Figure 8).
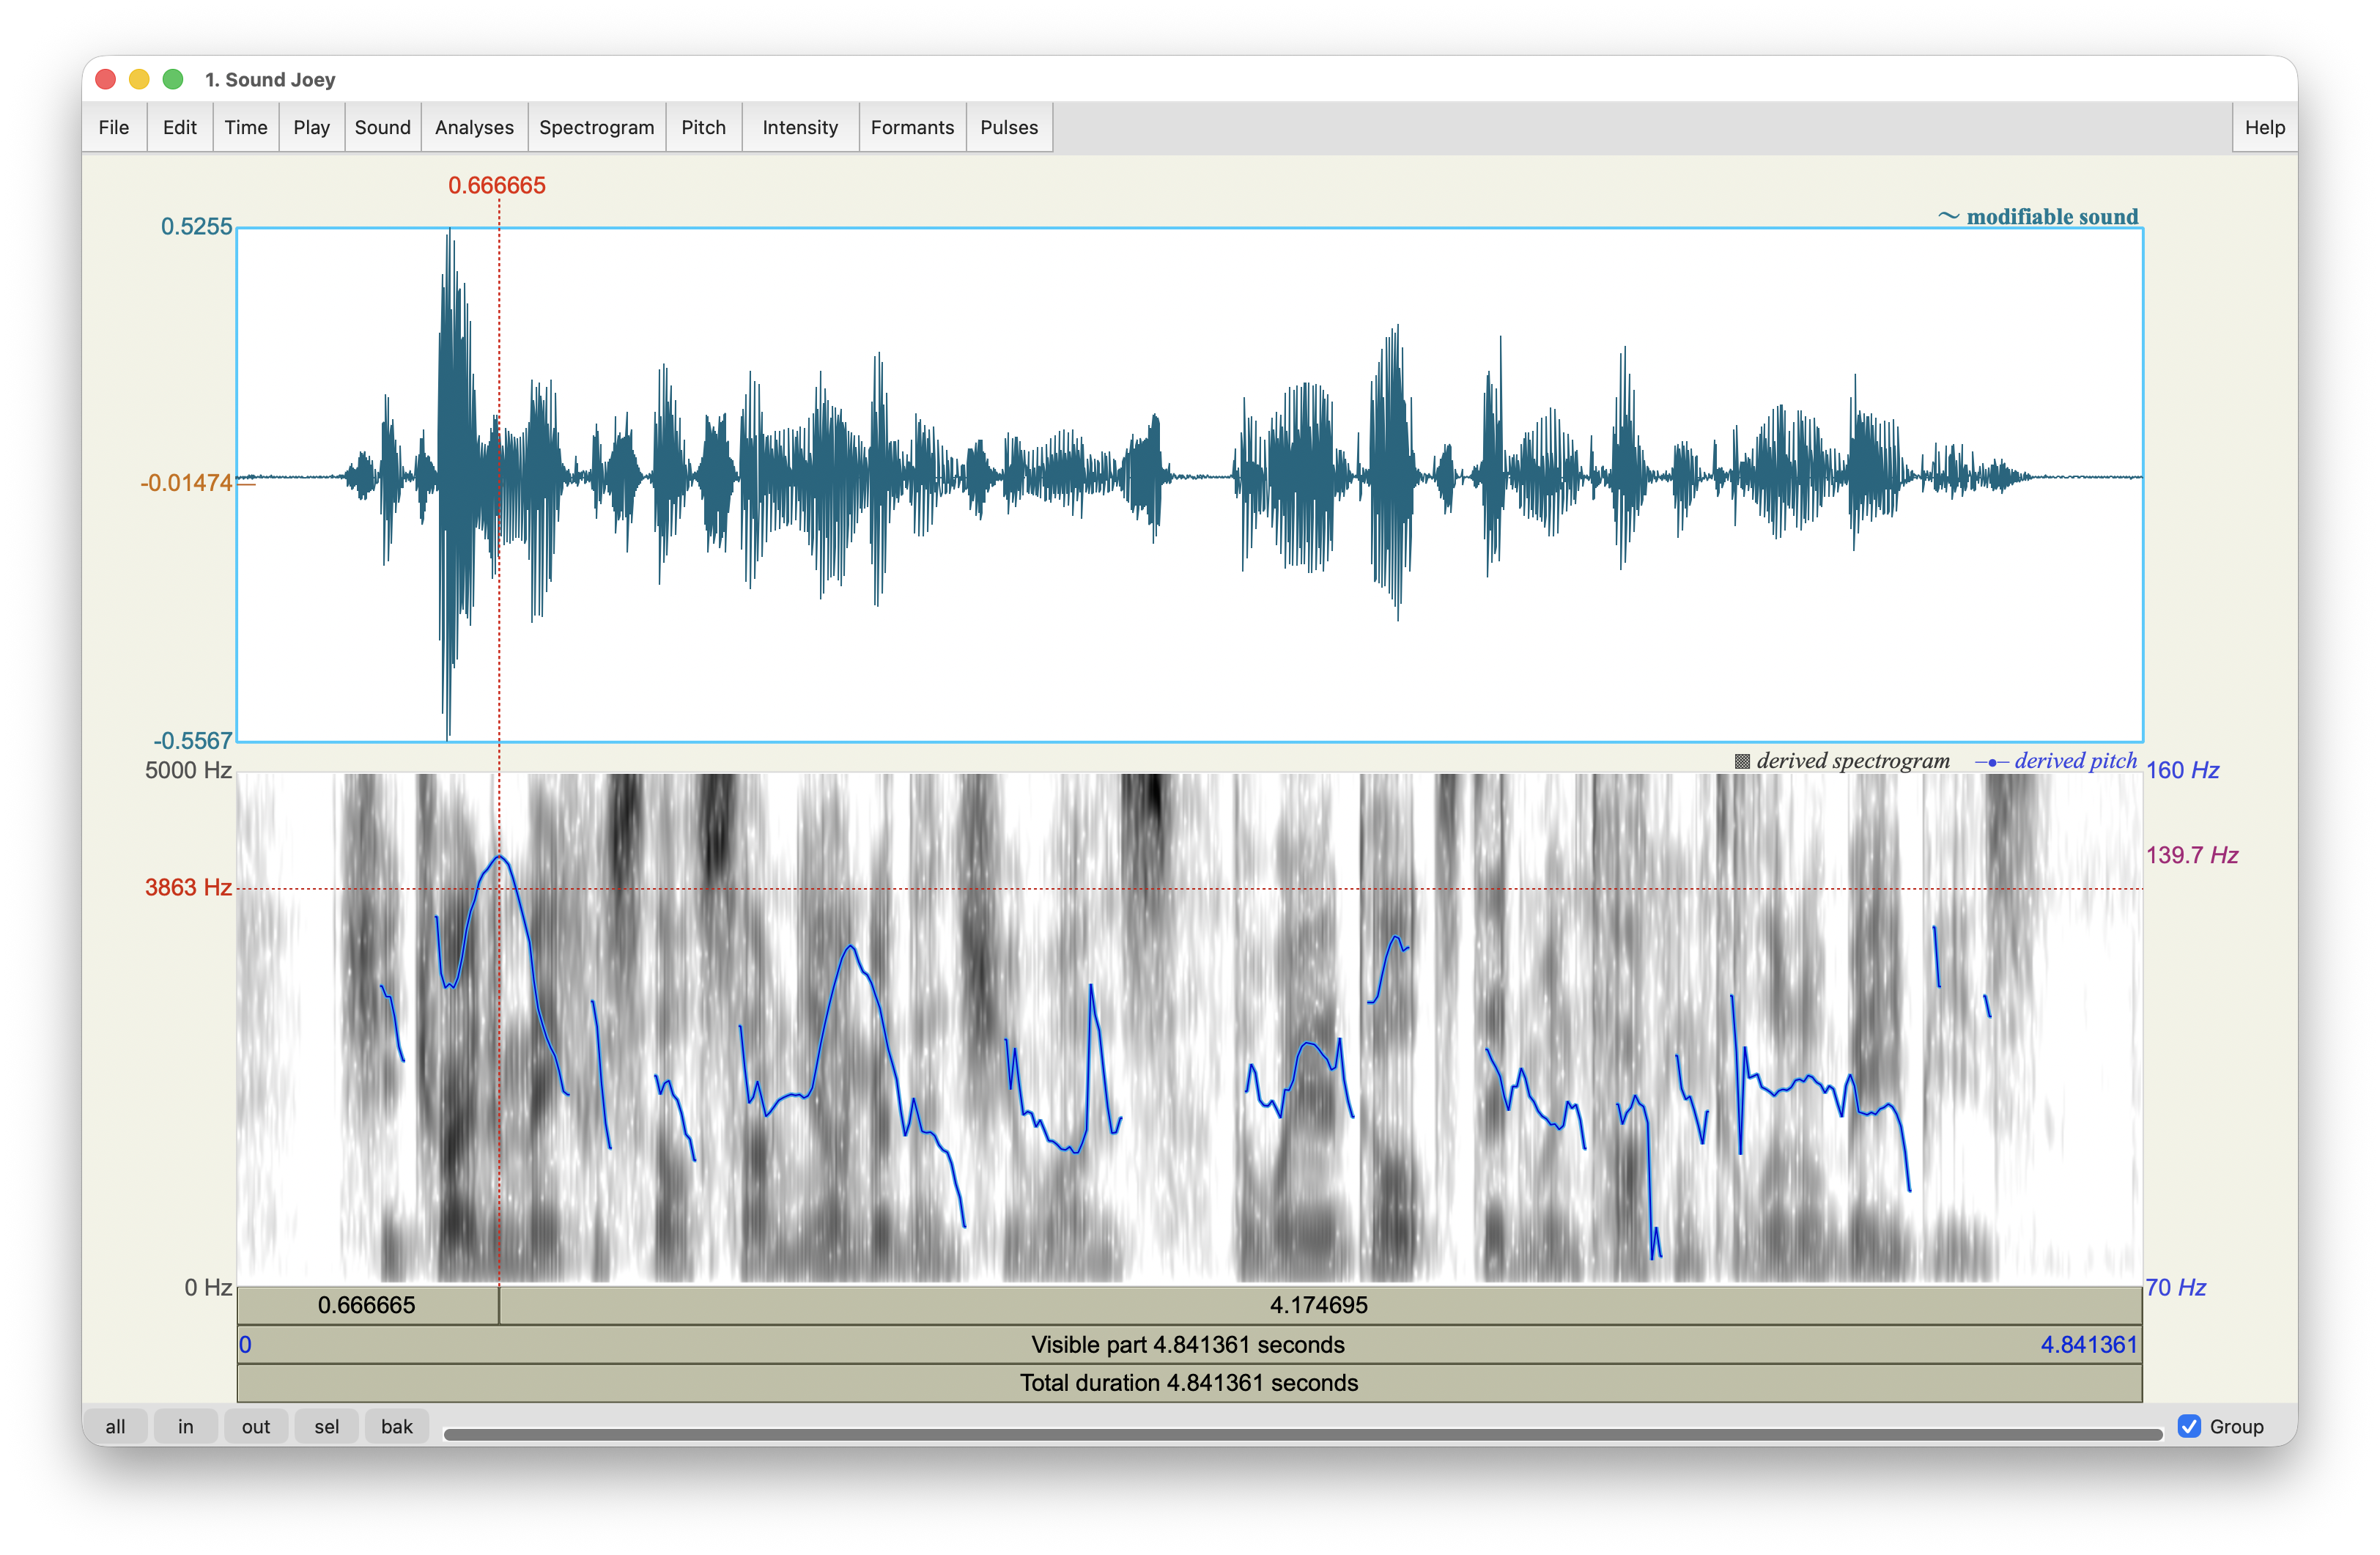
If that seems to jagged now, you can try zooming out a little, perhaps add another 100Hz or so to the top end. Play with it until you get something that looks good.
There are several algorithms that Praat can use to estimate pitch. In 2023, it switched to the method that we’re using now, the filtered autocorrelation method. The specifics of these methods are not important to beginning users, but you can read about them here.
Since adopting this newer technique, Praat’s pitch tracker has been much better. Previously, Praat’s pitch tracker sometimes it goofs up a little bit. In the figure below, I’ve switched it to the older method, the raw cross-correlation algorithm.
You can see right near the middle of the sentence, there is a pitch measurement that is super high, right at the top center of the spectrogram. (This happened during the last consonant of the word was.) There, Praat thinks the pitch is somewhere close to 500Hz, which would be a high falsetto for me. It’s clearly not a good measurement. The newer method avoids these erroneous measurements. Unless you have a reason to continue with an older method for comparison purposes, I’d recommend sticking to the default, which is the filtered autocorrelation method.
4.2 Measuring pitch
If you want to find the exact pitch at any point, you can. At the point where my cursor is located in Figure 6 (about 6.666 seconds into the recording) is the point where the pitch is at its maximum. An easy way to tell what the pitch is at that point is to look at the right hand side—139.7 Hz. Another way to get this exact pitch is to click on the point along the blue pitch contour that you want to measure and go to Pitch > Get pitch. A new window will pop up, the Praat Info window, and will give you a very specific pitch estimate (Figure 9).
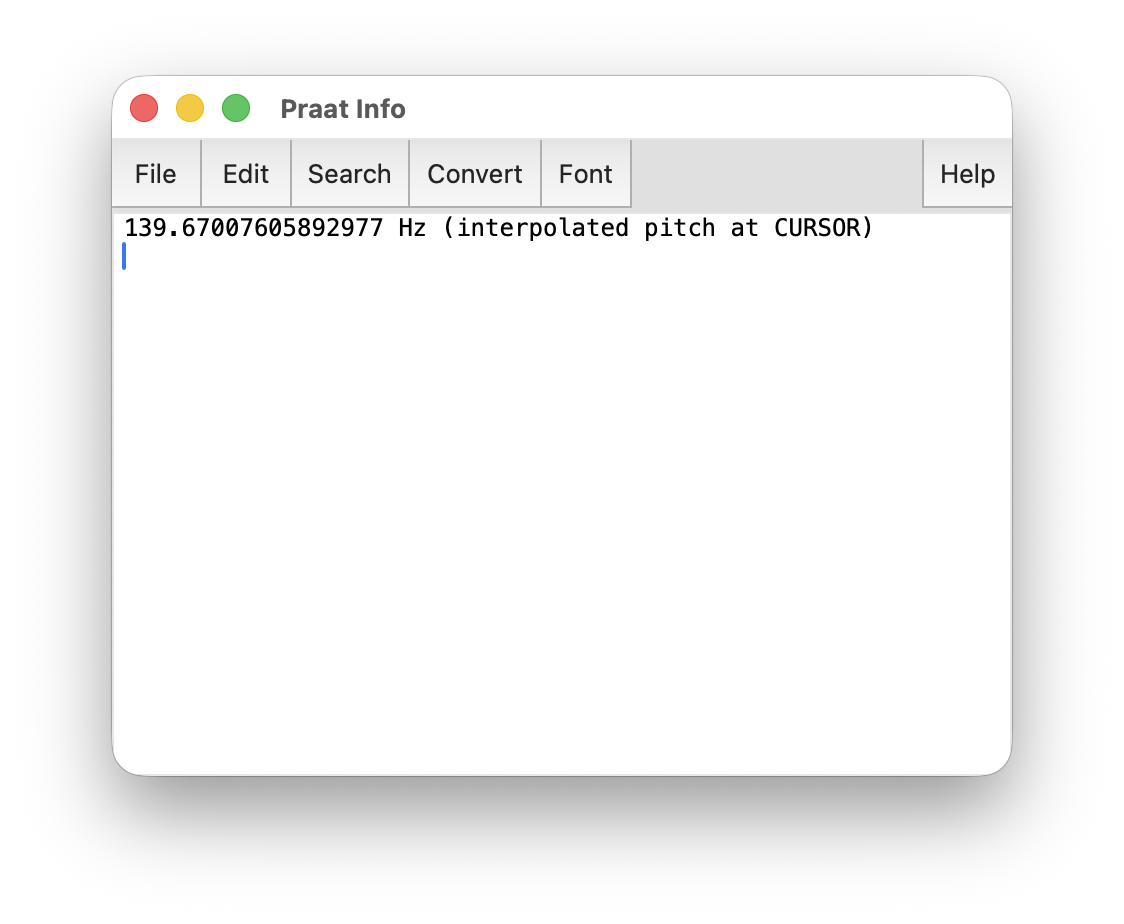
I don’t know why Praat’s measurements have so many decimal places, but I guess it’s better than not having enough!
Take a few minutes and see if you can work with pitch by yourself. Here is a problem to solve. Try to figure it out before you click on the solution.
I know that the point that was selected in Figure 6 is indeed the location of the maximum pitch. How can you find the precise moment of the highest pitch in your recording? Explore the options in the Pitch menu and see if you can figure out how.
The key to finding the point where the maximum pitch is located is this function: Pitch > Move cursor to maximum pitch. In order for this to work though, you’ll need to highlight a range of audio instead of just a single point. Unless you have wonky measurements, this should work just fine.
4.3 Visualizing the pitch overlay
It may be helpful to produce a high quality image with that blue overlay. In this section, we’ll look at how to create visualizations in Praat. Much of what we’ll learn in this section is transferable to other visualizations. We won’t explicitly talk about them as much though because the process is very similar to what we do here.
Since the spectrogram isn’t important here, we can hide it. Go to Spectogram > Show spectrogram and uncheck the box. You should now have an unencumbered look at the pitch contour. However, it’s a little too devoid of context, so I’ll load in the TextGrid so we can see how the contours line up with the words. Figure 10 shows what that looks like.
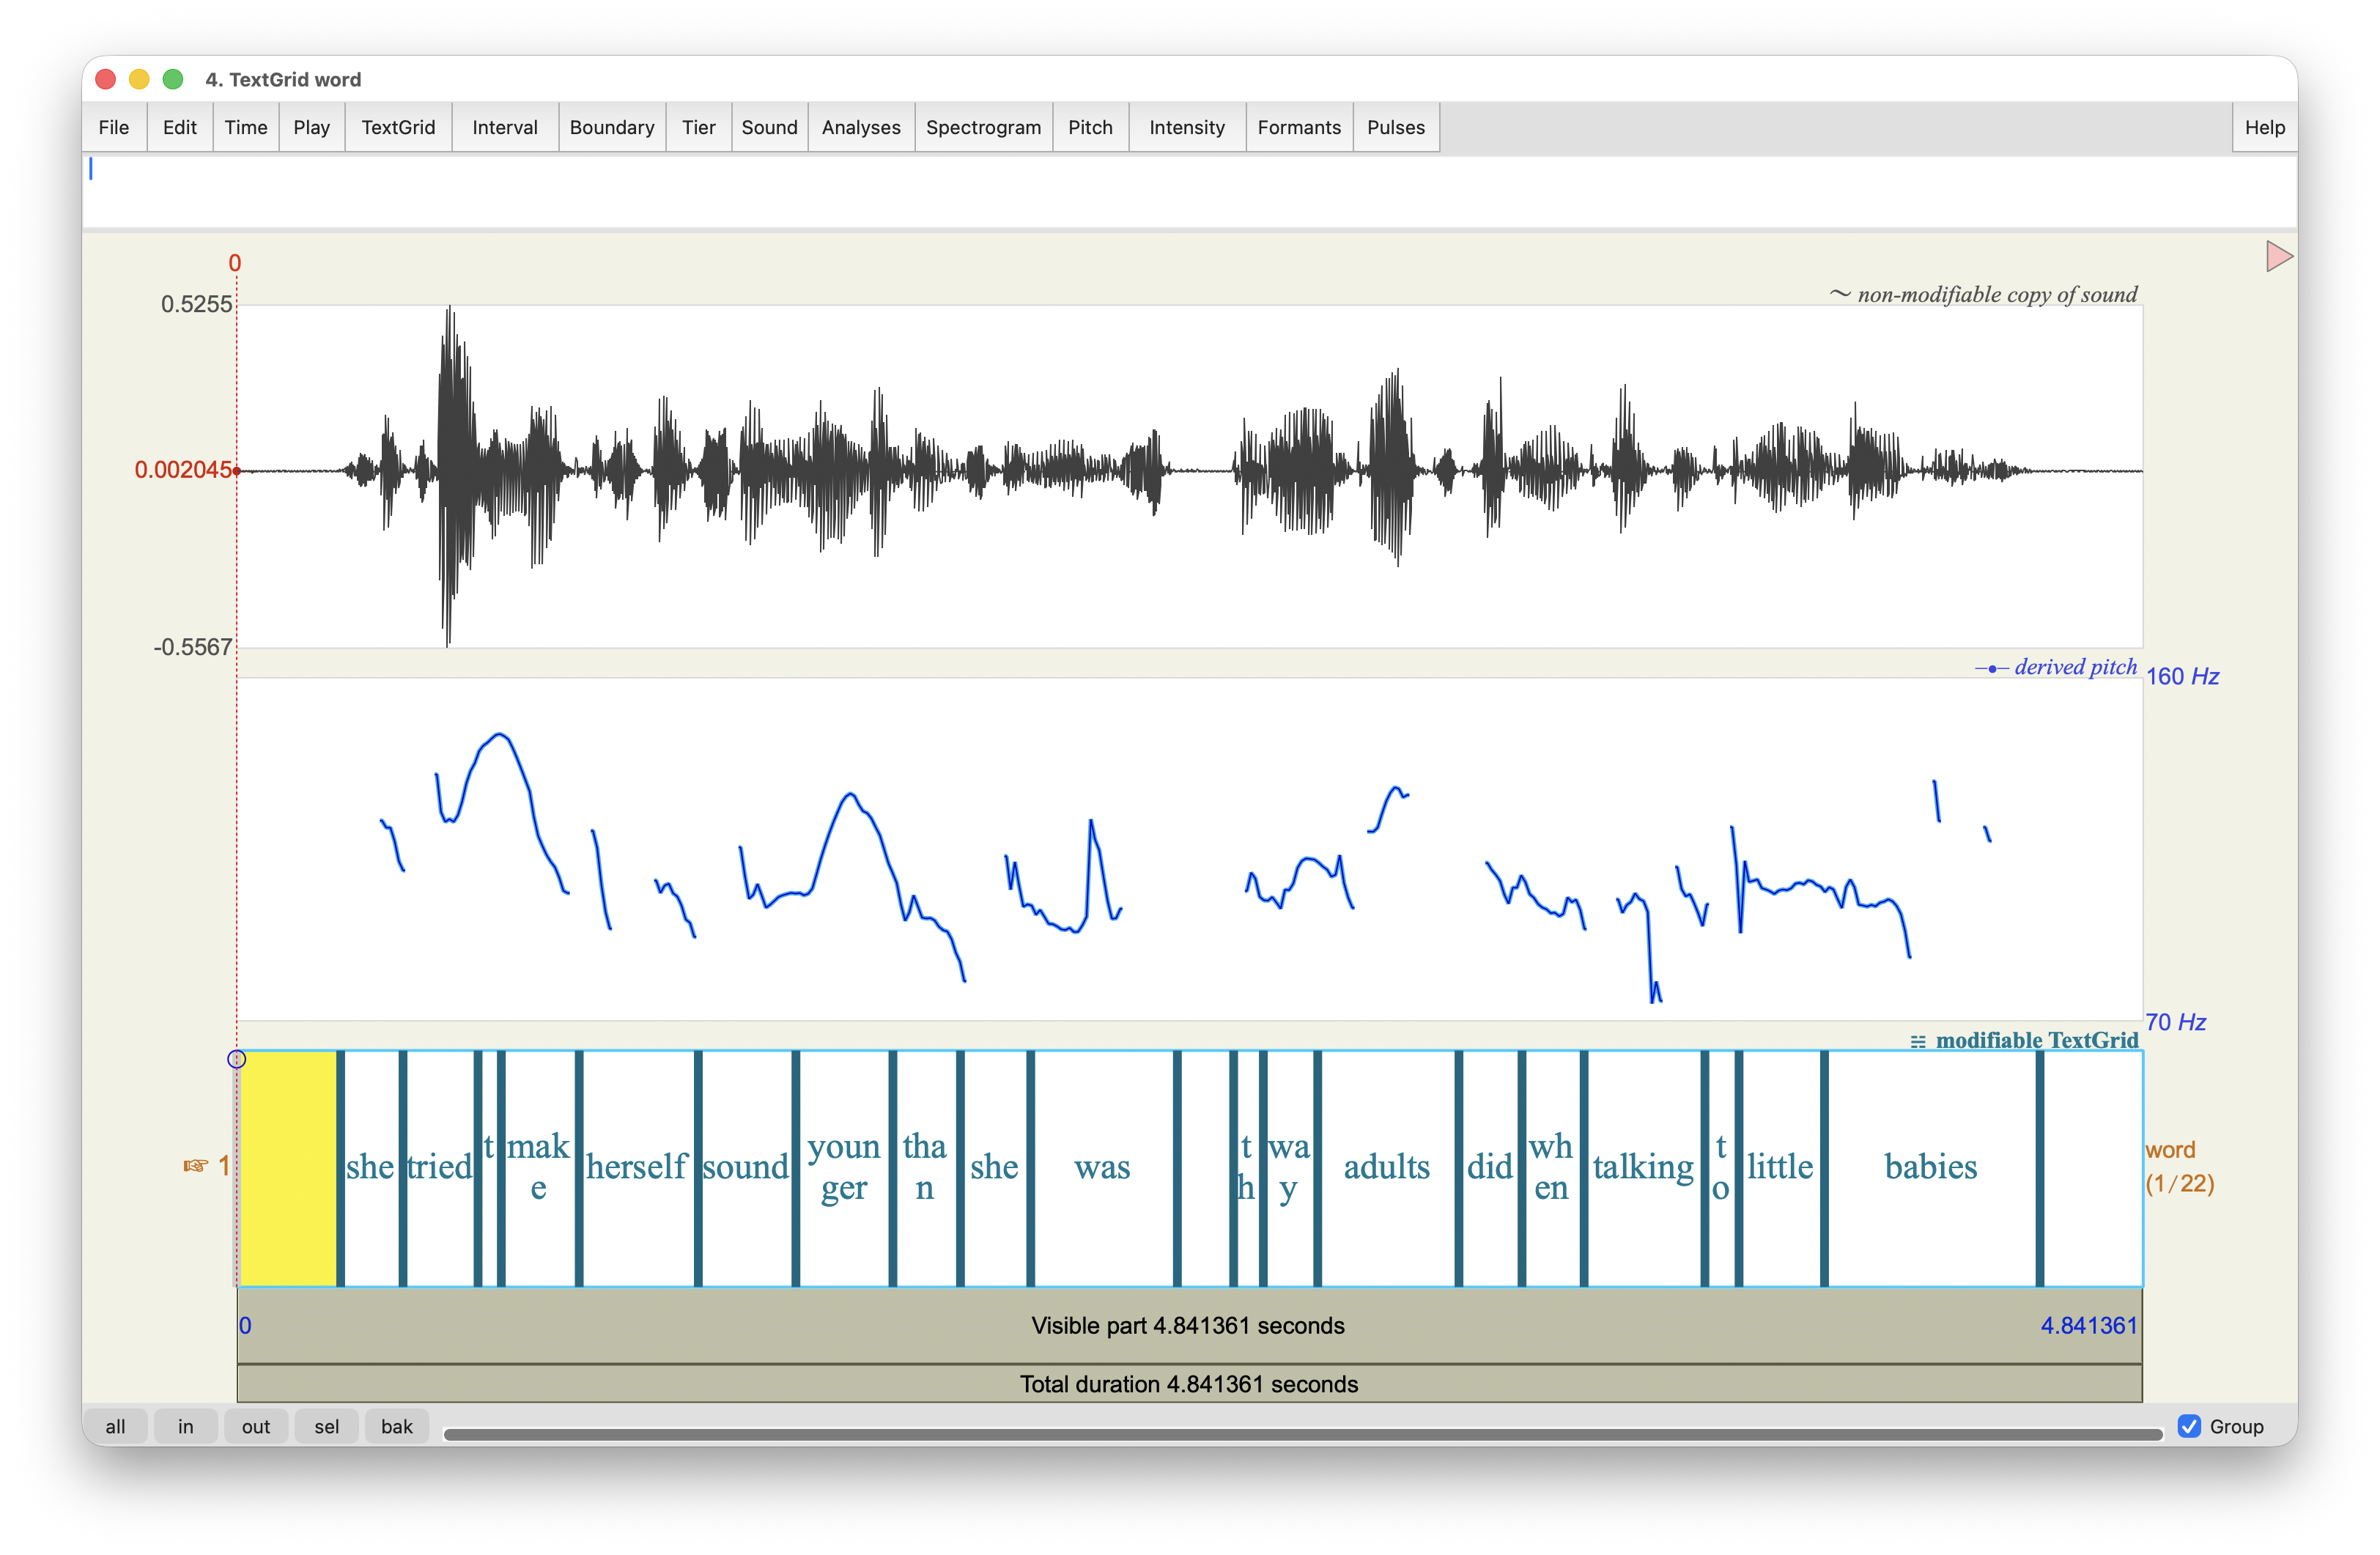
At this point, a lot of people just take a screenshot of Praat and call it good. But we can do better.Remember that window we closed when we opened Praat? The one with the pink rectangle? It’s time to use that. (Don’t worry, we’ll make it pop up again automatically.) Go to Pitch > Draw visible pitch contour… which is close to the bottom of the Pitch menu (Figure 11).
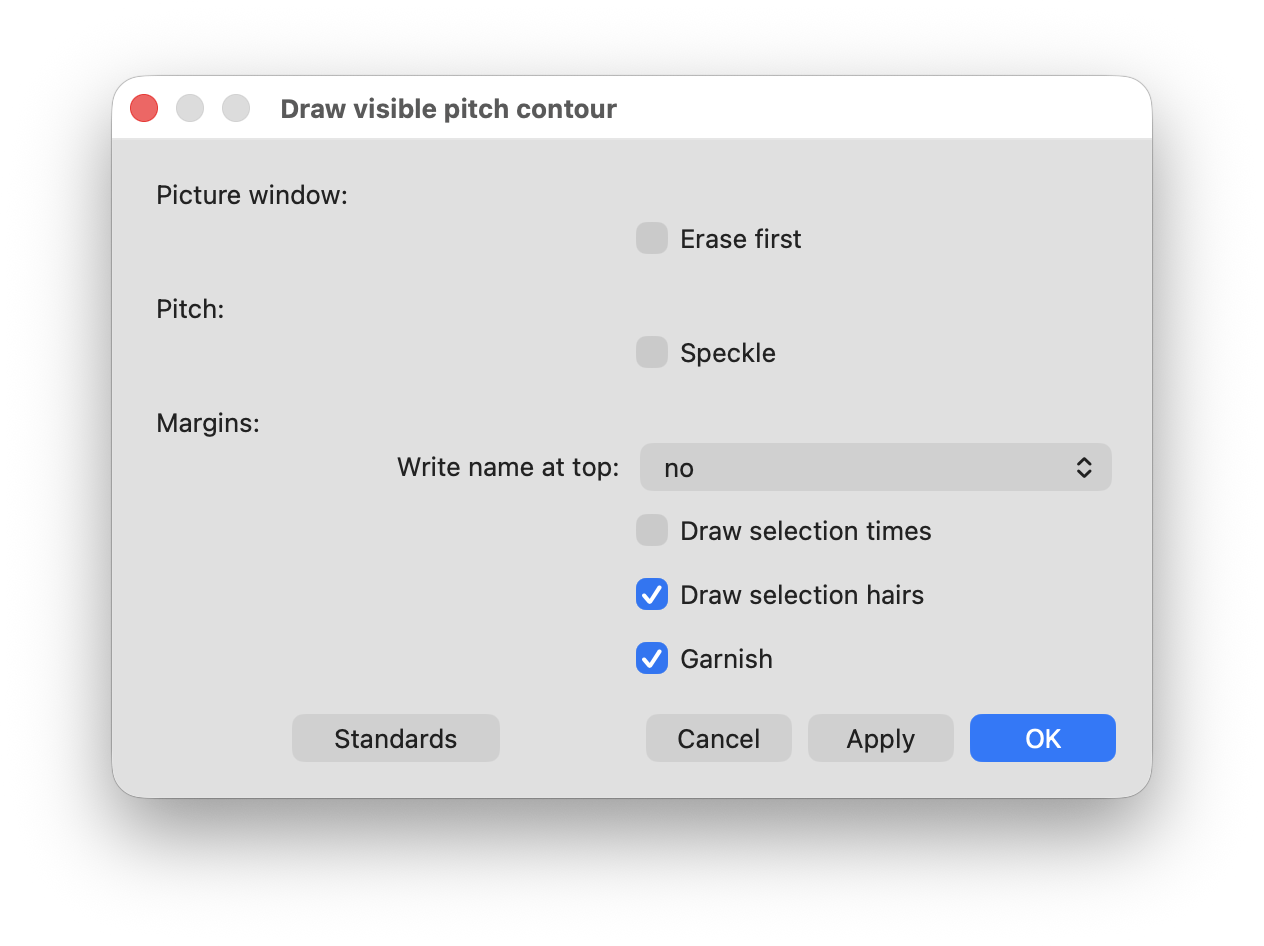
Fow now, we can accept the default settings. Go ahead and click Apply and you should see a window that looks like Figure 12.
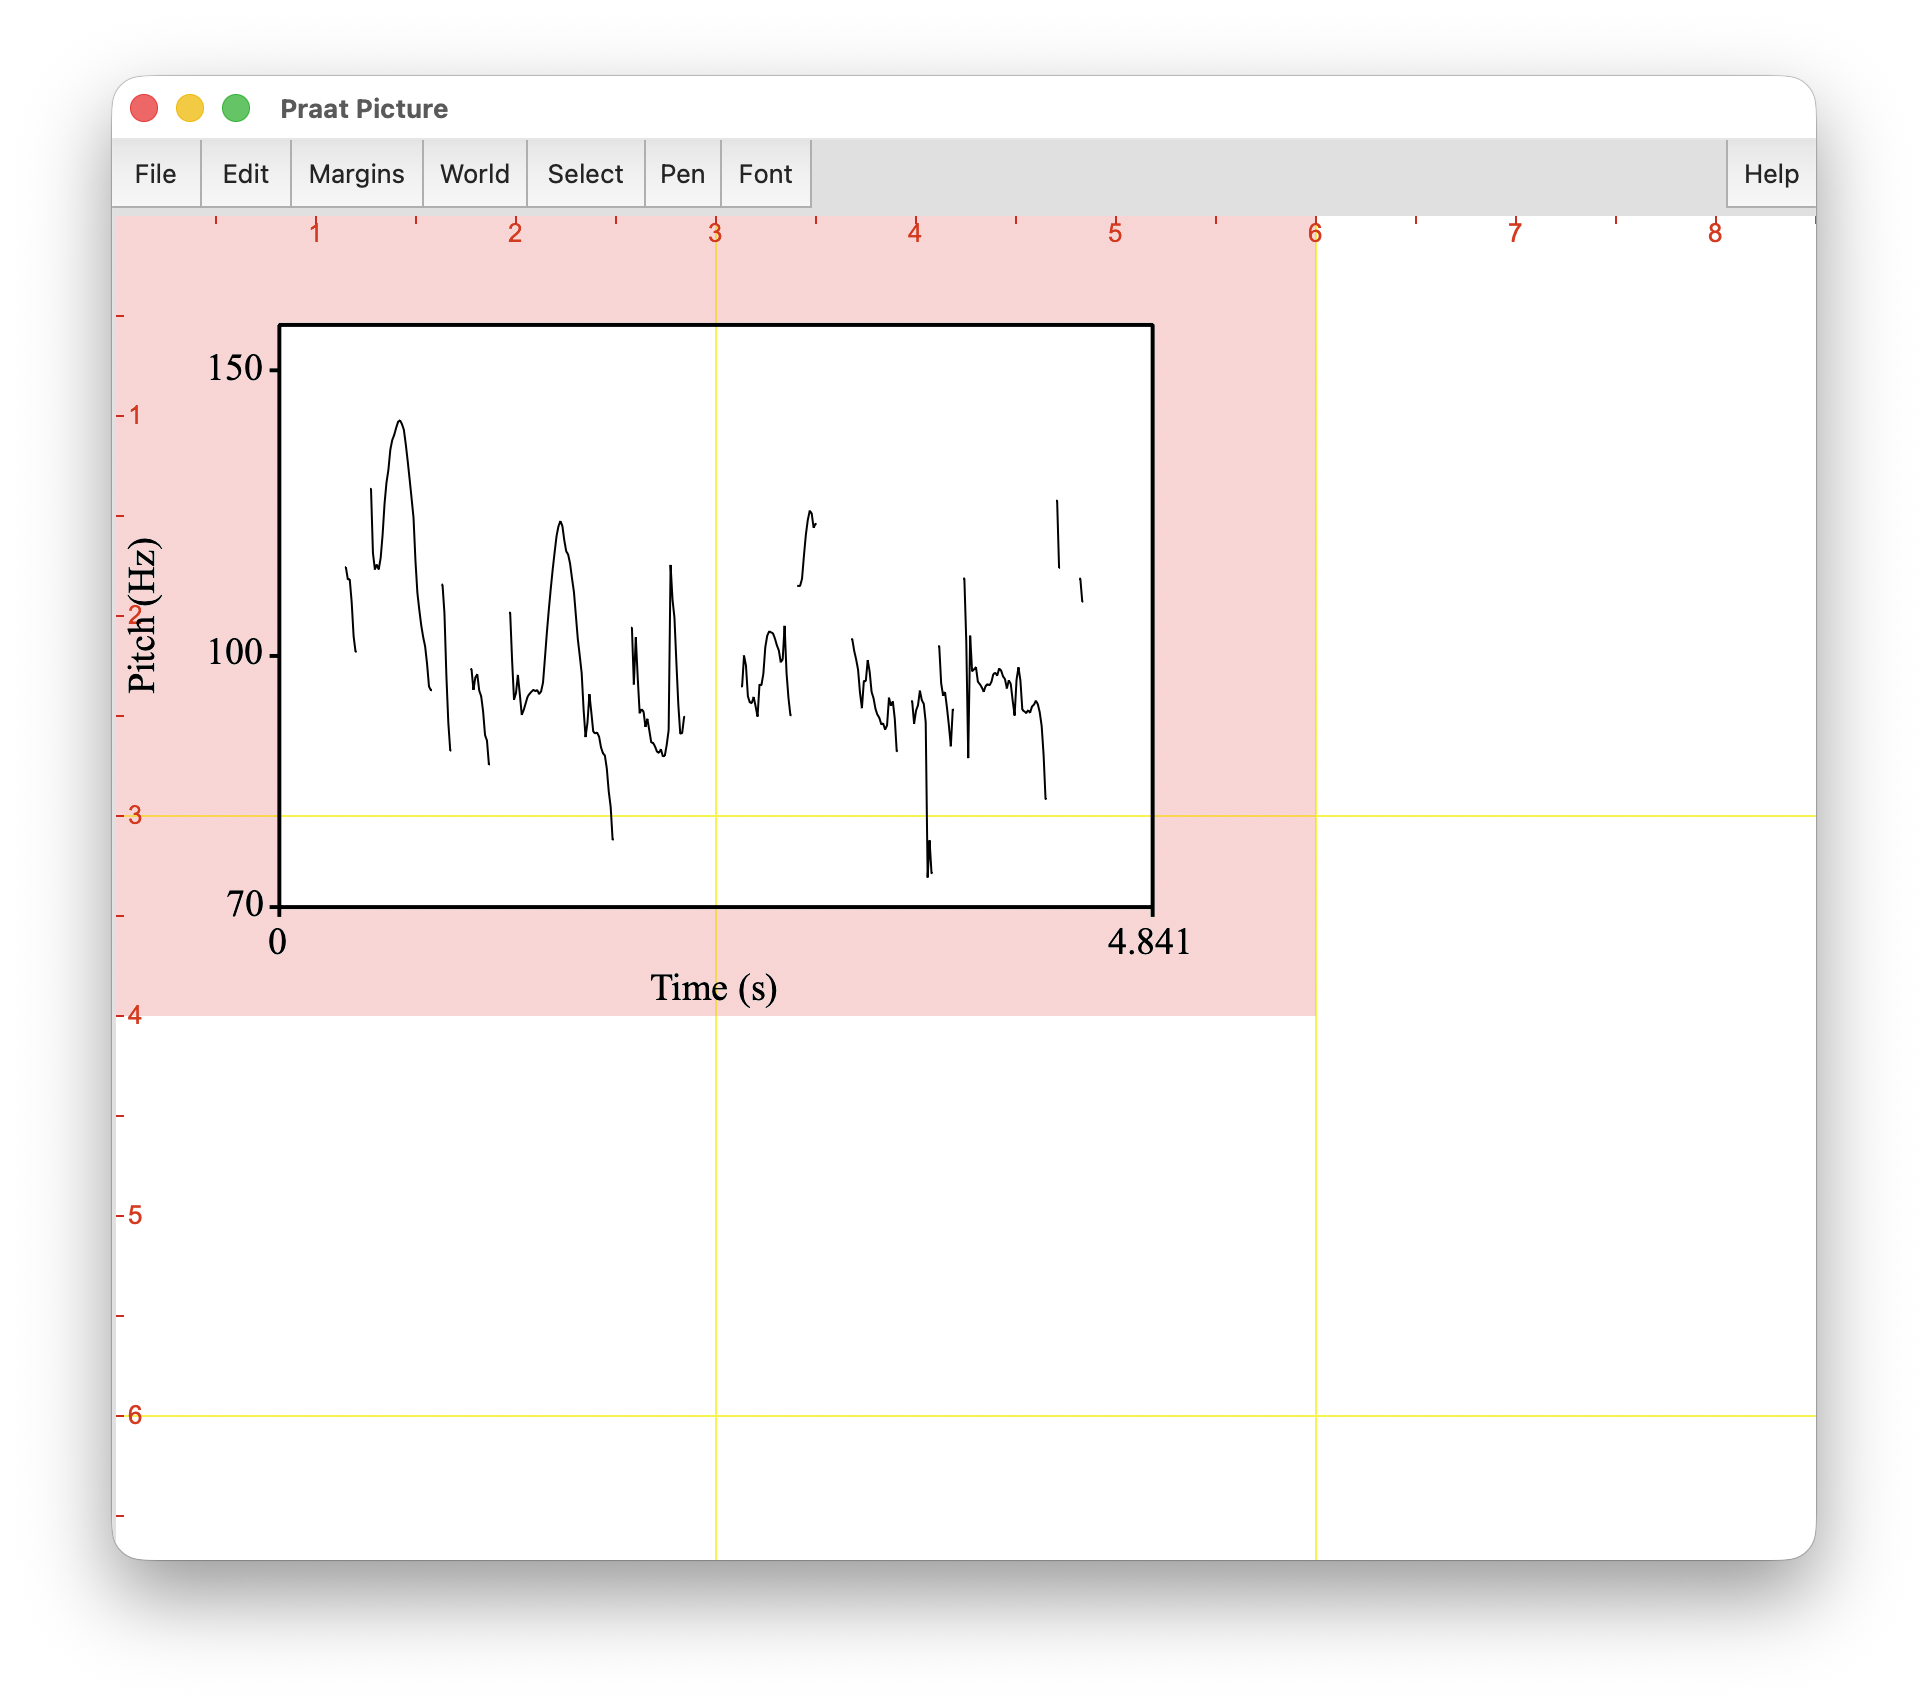
Here we see the Praat Picture Window for the first time in action. Hopefully you can now see what that pink rectangle does. The area inside of it defines the area that the thing you want to draw—in this case, the pitch contour. If you’d like it to be bigger, go back to the Praat Picture Window and click and drag and you should see the pink rectangle change size. For me, I’d like it a little bit wider. Once you’re satisfied with a size, you back to the Draw visible pitch contour window (or, if you closed out of it, go to Pitch > Draw visible pitch contour…), make sure the Erase first box is checked, and then hit Apply again, and you should see your image update.
Spend a minute or so and play around with the other settings in the Draw visible pitch contour window. What do each of the following do?
- Erase first
- Speckle
- Write name at top: no, far, and near
- Draw selection times
- Draw selection hairs
- Garnish
Figure out the combination of settings that you’re satisfied with.
You can export this image in a high-quality image format. In the Praat Picture Window, go to either File > Save as PDF file… or File > Save as 300-dpi PNG file…. (You can of course explore the others if you’d like, but these are probably the most common). Save the file to your computer and check it out to make sure it looks the way you want.
4.4 Adding a TextGrid to the pitch visual
A visualization of a pitch contour by itself is not super helpful since there is no context. Fortunately, Praat has a built-in function that lets you visualize the pitch contour and the TextGrid at the same time. Go back to your TextGrid window and go to TextGrid > Draw visible pitch contour and TextGrid. That’ll take you to a new window that has many of the same options. Erase what you have so far but otherwise the default settings and seeing what it looks like.
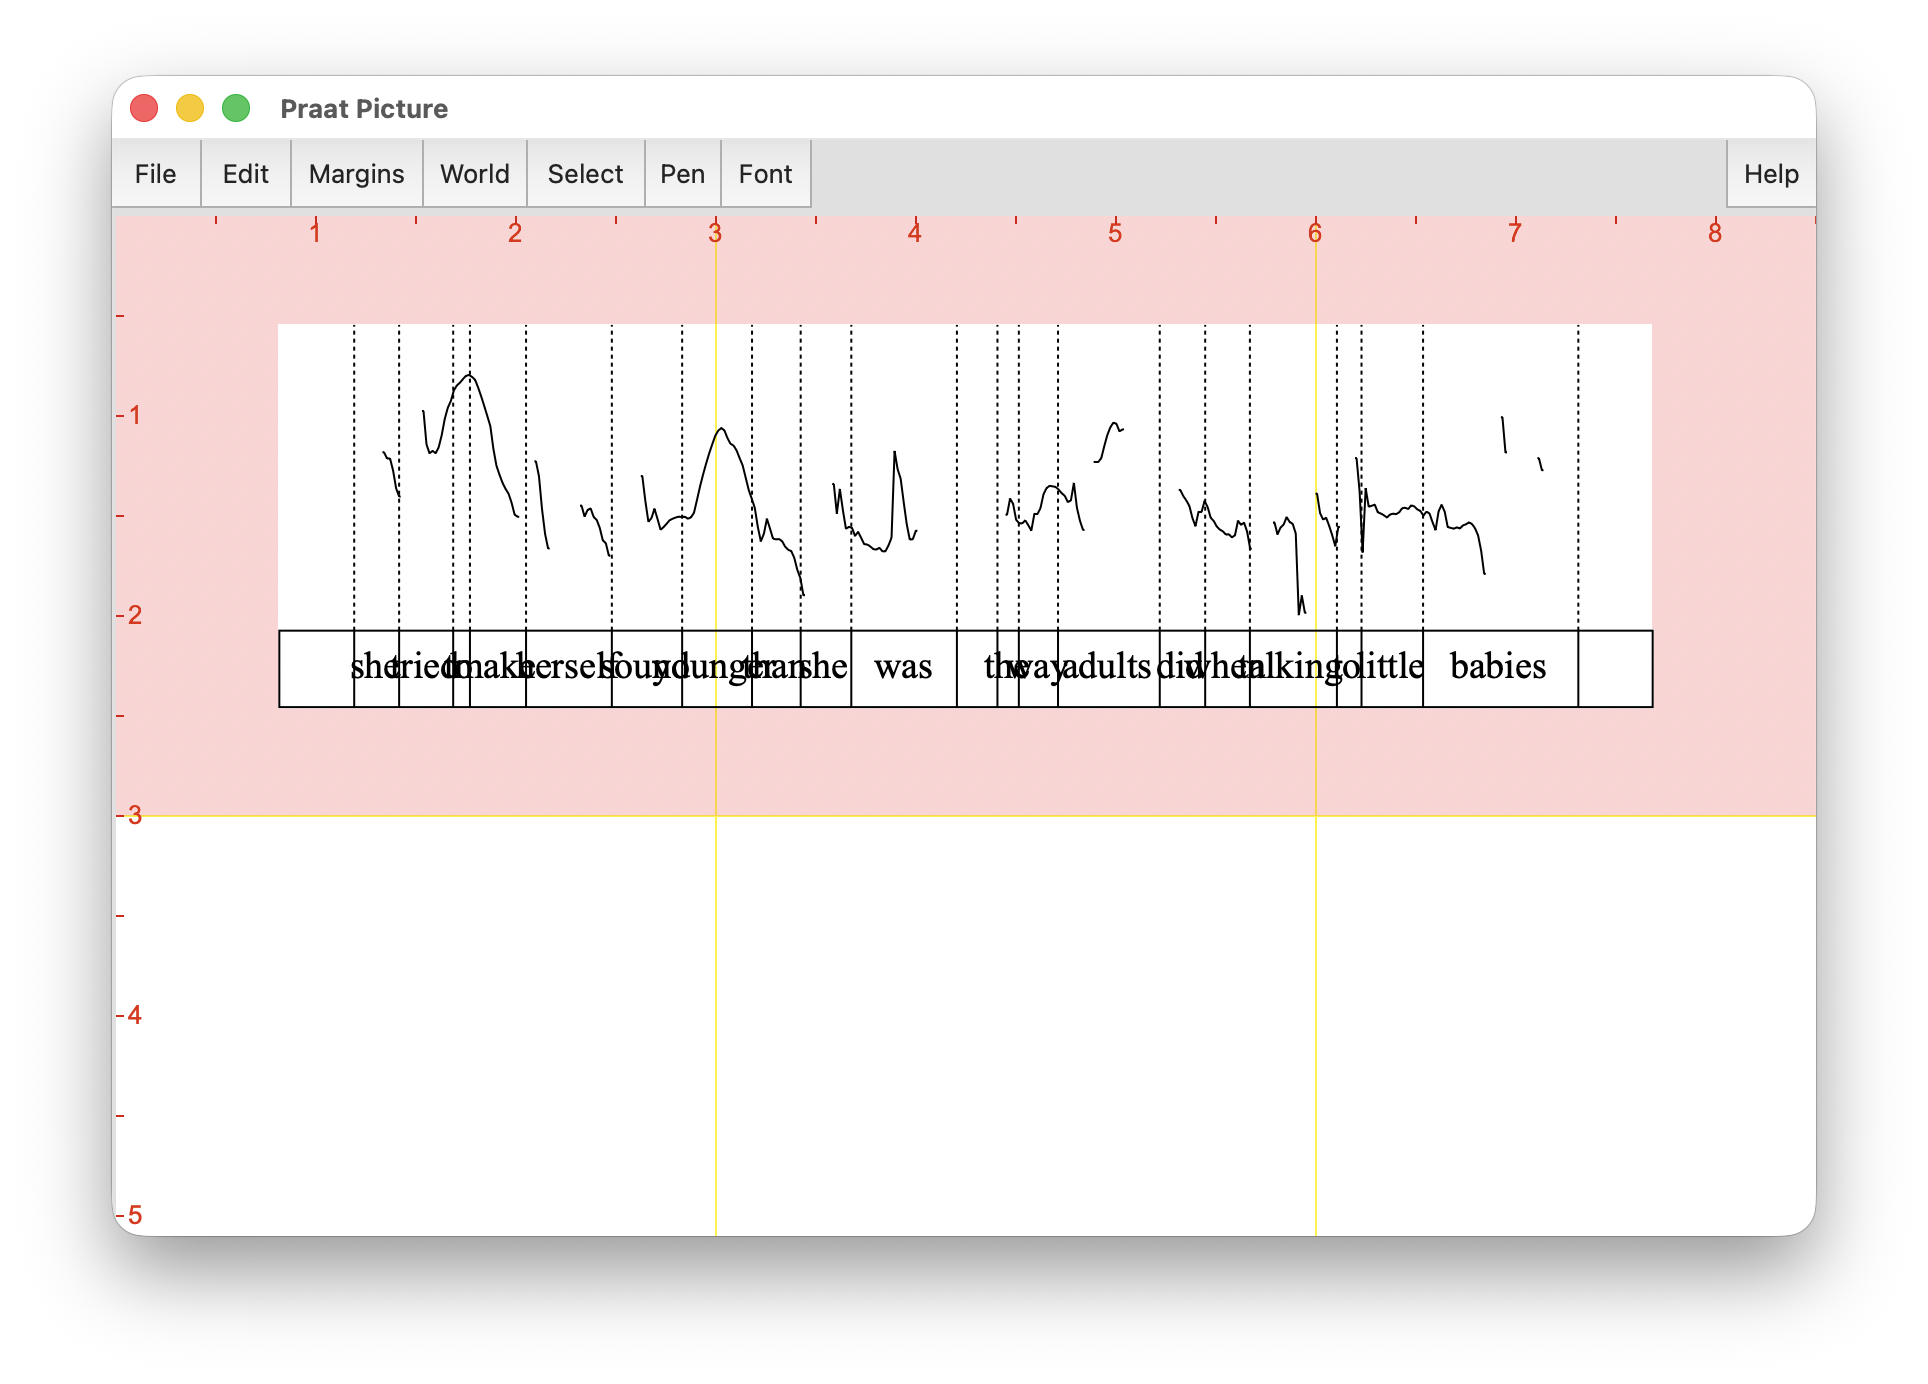
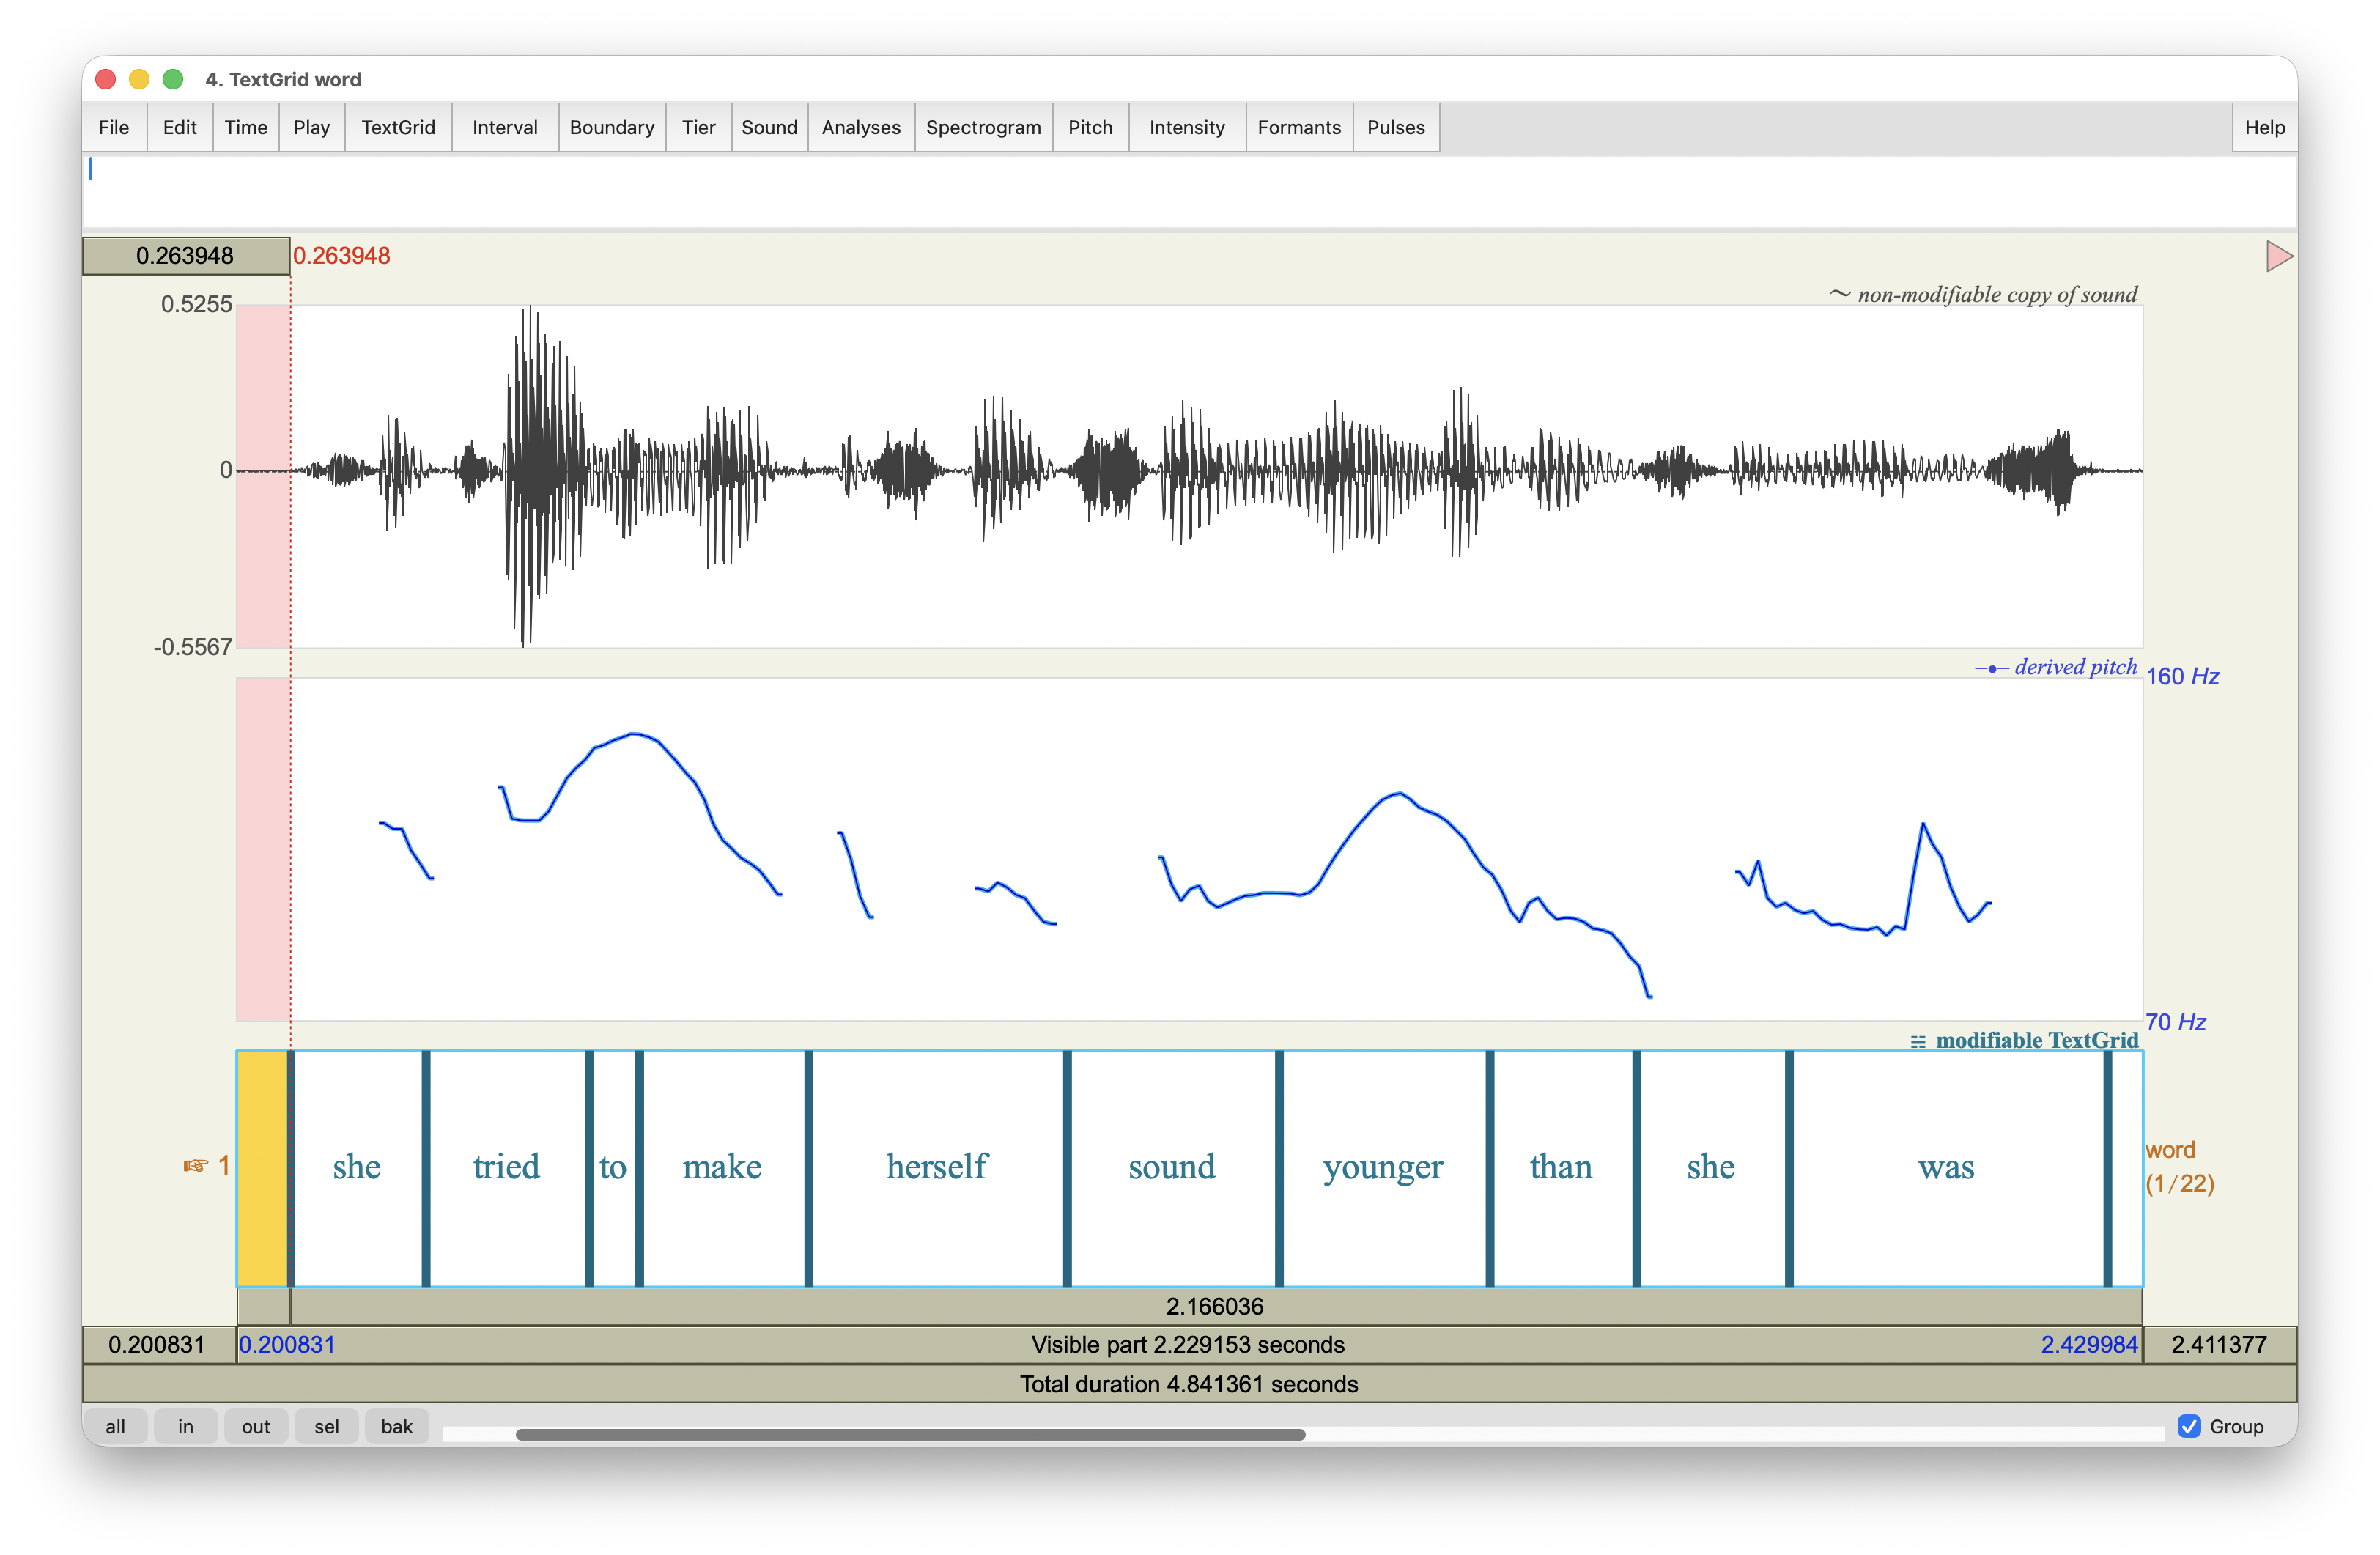
If you have too much audio selected, you may find (like in Figure 13) that it’s a bit messy. The words are all on top of each other. There’s just too much that it’s trying to squeeze into a single window. Let’s zoom into a smaller range of the audio, perhaps just a few seconds, or rather, a single intonational contour, and visualize that. Notice that Praat’s command is called Draw visible pitch contour and TextGrid. So we need to actually zoom in in the TextGrid window and then visualize that.
Here’s the portion of the TextGrid that I zoomed into.
Here’s the drawing itself in the Praat Picture window. Notice that I checked the Garnish box to get some of that additional detail.
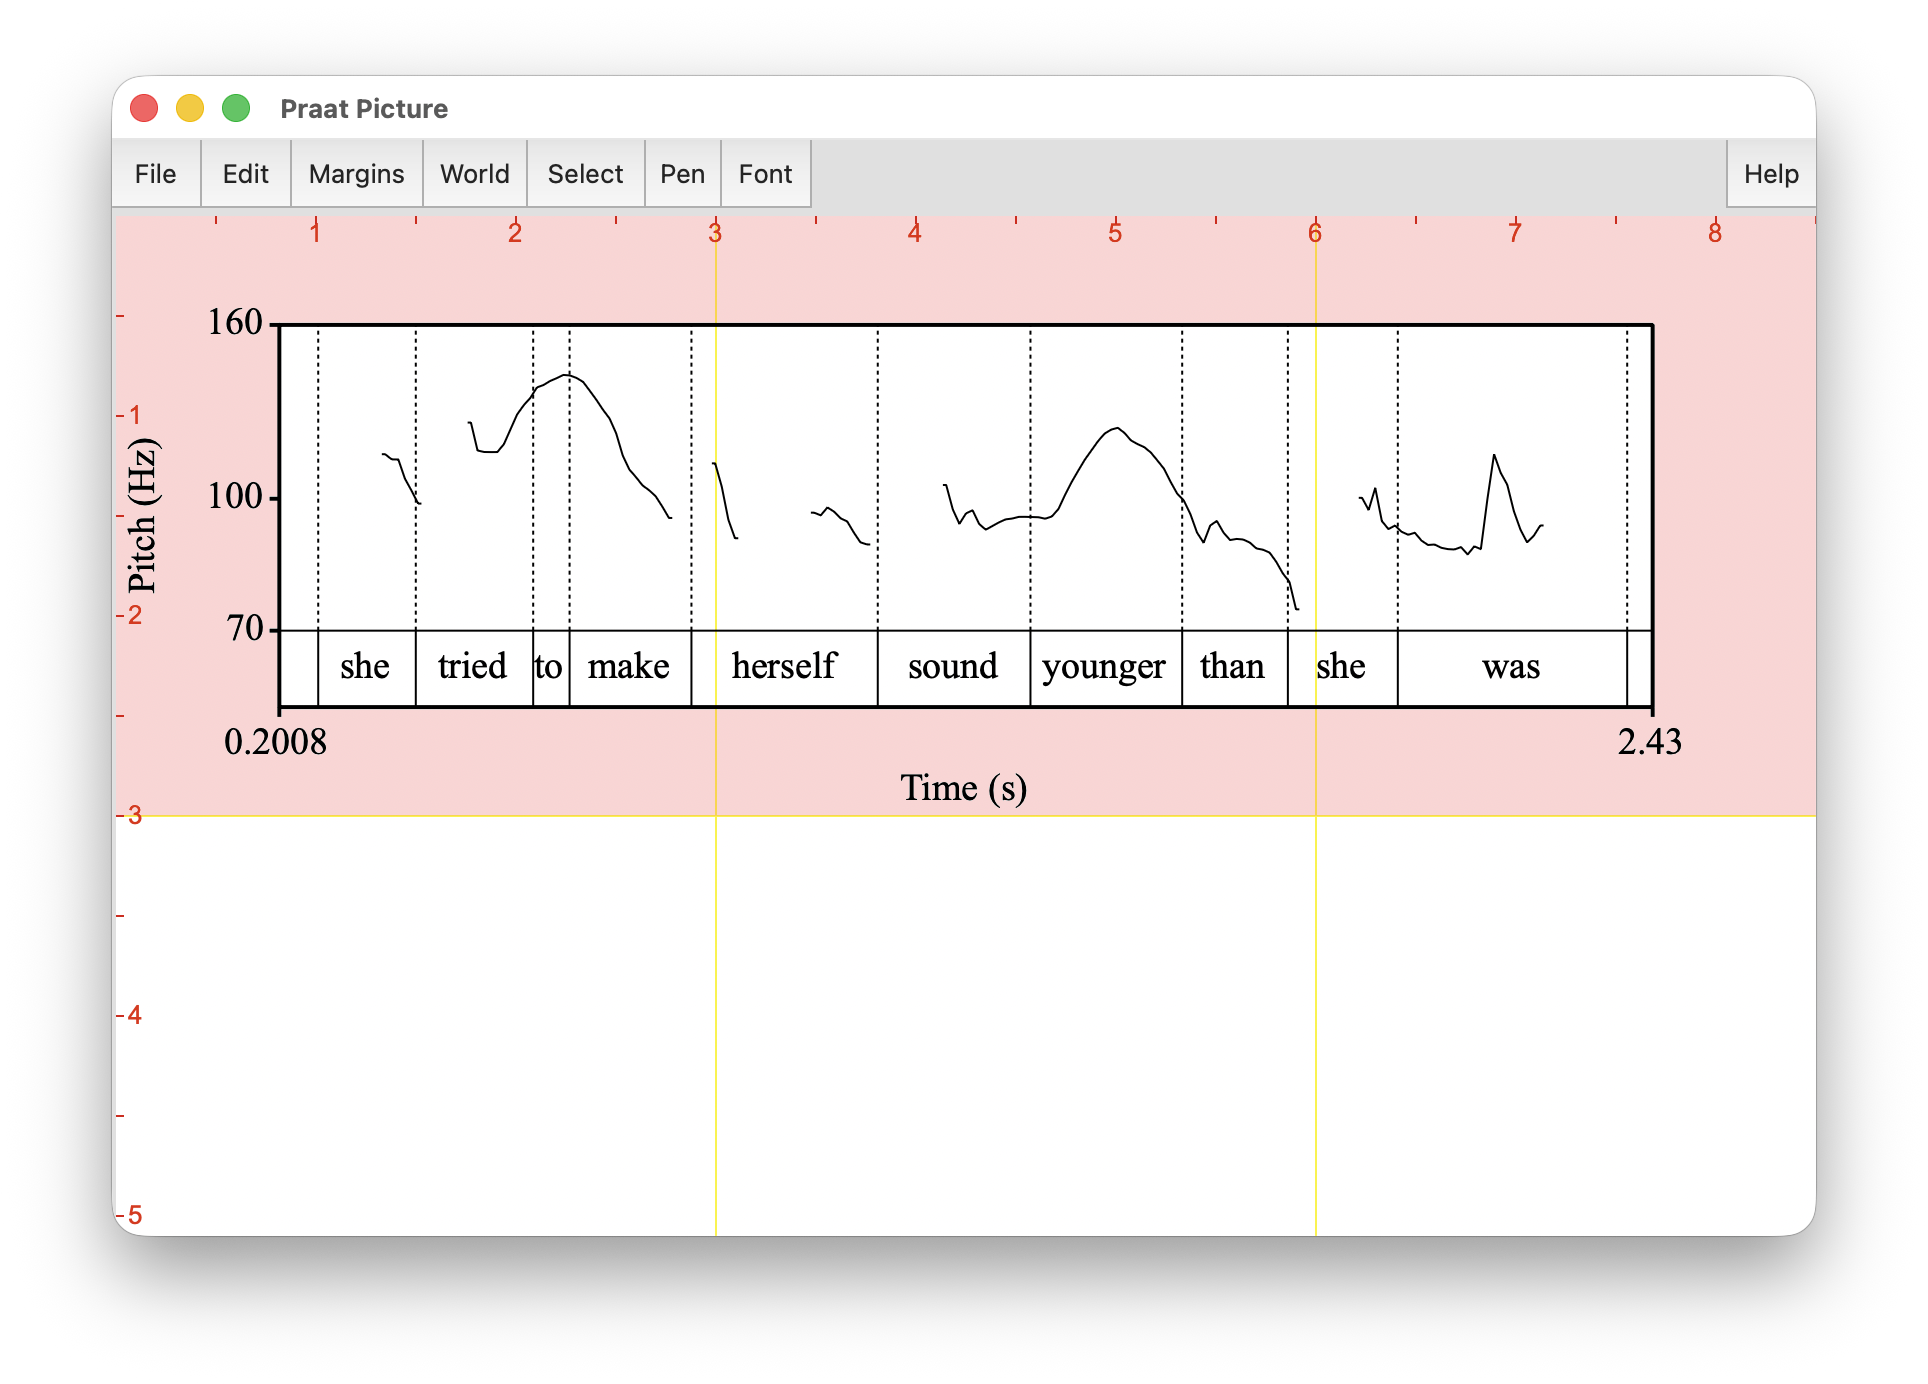
Here’s what the image file looks like when I export it.
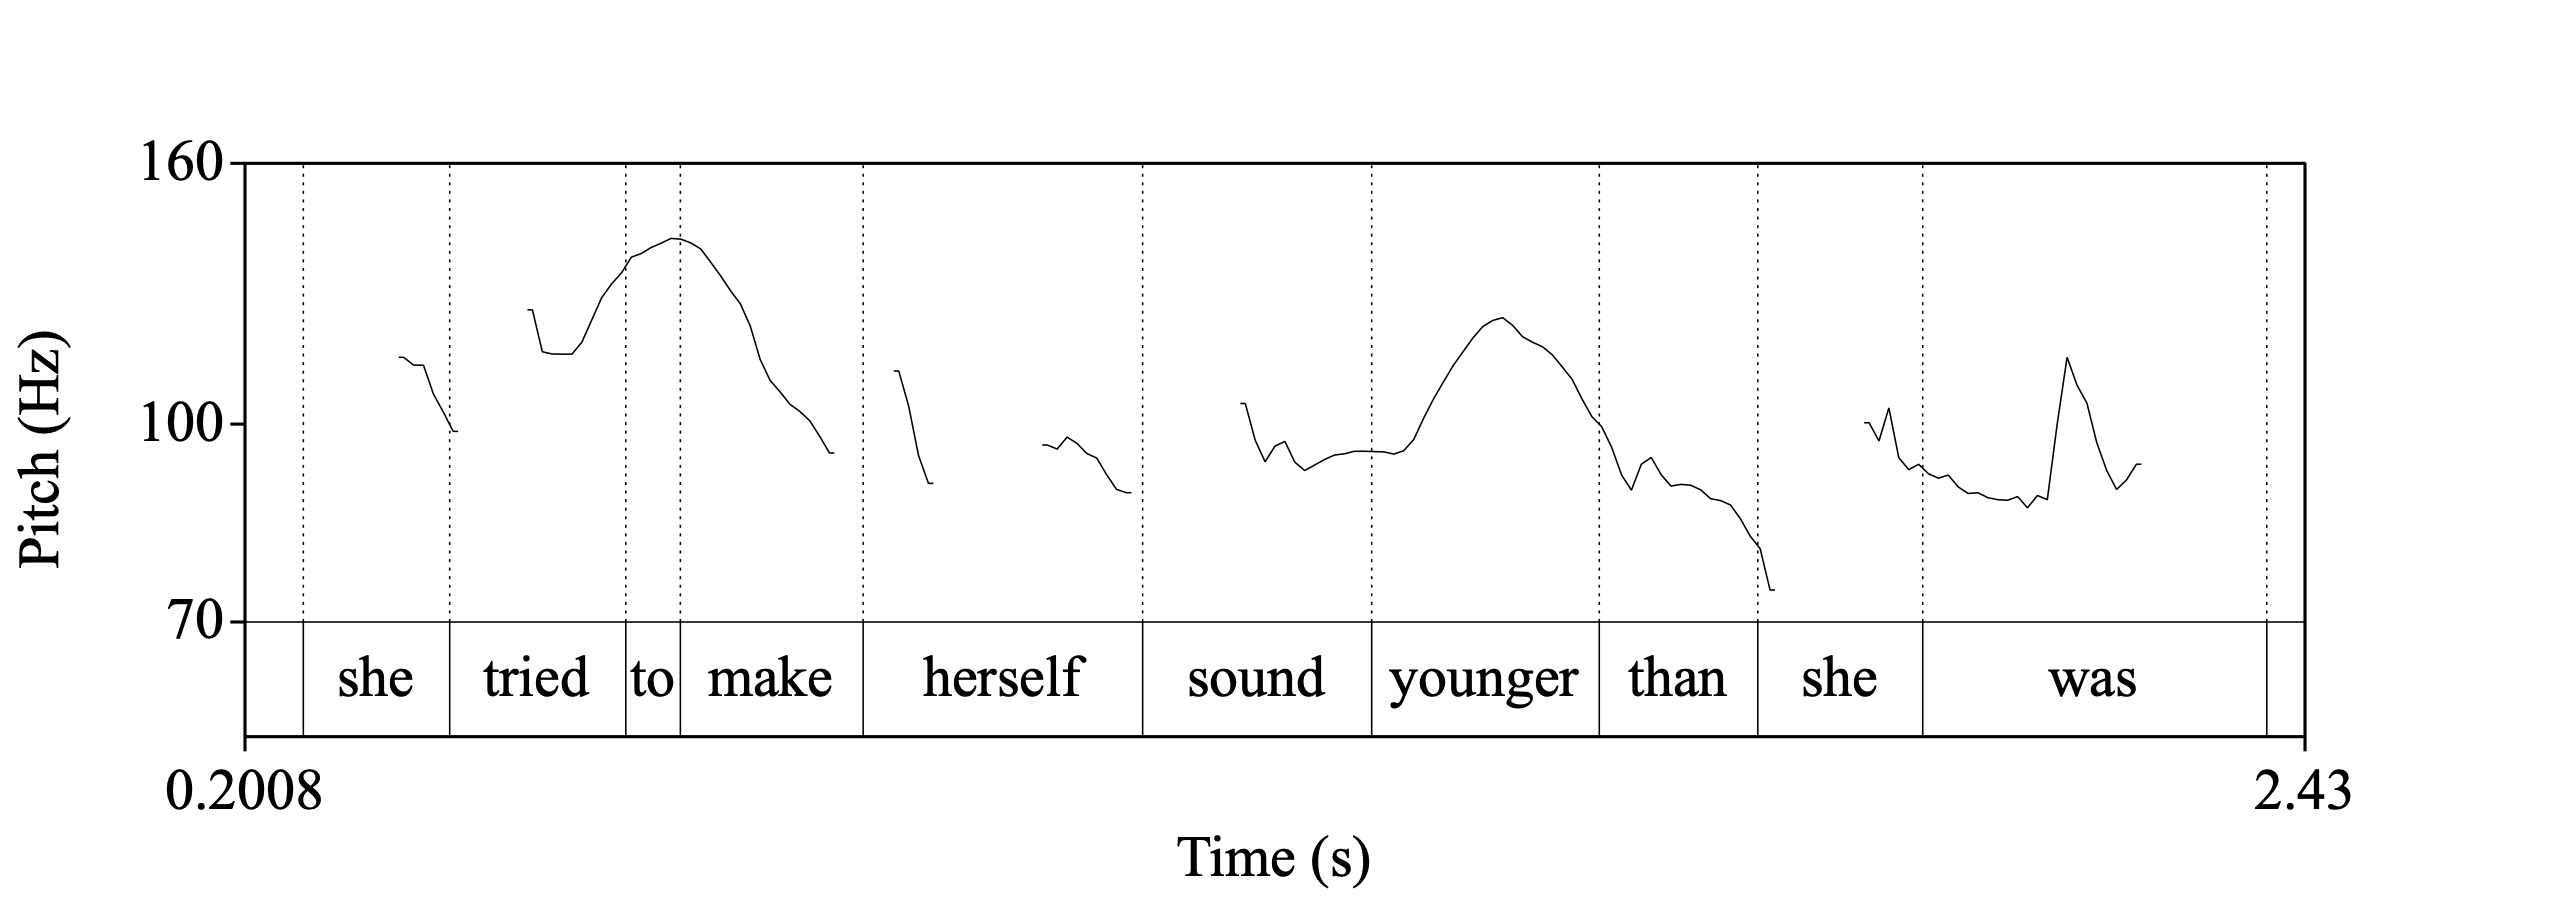
So that’s it for pitch for now! In this section, we’ve covered how to extract some basic pitch measurements and how to visualize pitch, both by itself and with an accompanying TextGrid. In the next section we’ll shift our attention to voice quality. Now that we’re done with pitch, go to the TextGrid window, then go to Pitch, and uncheck the Show Pitch box.
5 Formants
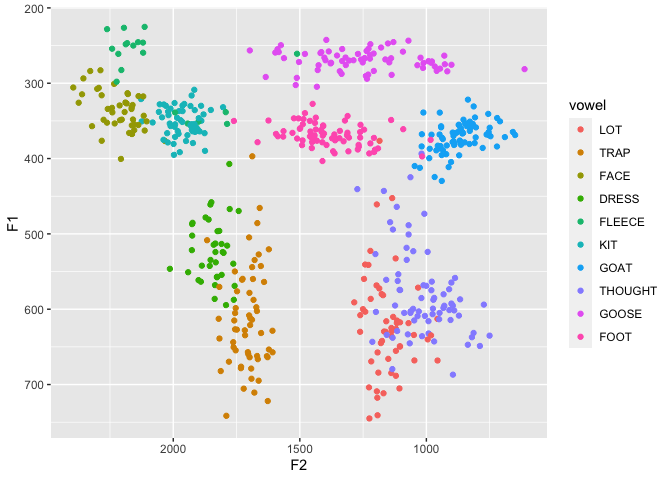
The next acoustic measure that we’ll extract manually is formant estimates. You may know that formants are frequencies that resonate particularly strongly in the mouth as a result of the tongue’s position in the mouth creating resonating chambers. Vowels and other vowel-like sounds (like /ɹ/ and /l/) have formant frequencies. Experimental work has shown that the first three formants are particularly important for identifying vowel sounds. In fact, the vowel trapezoid that you might be familiar with from an IPA chart are based directly on the first two formant frequencies. Figure 14 is a plot of my formant measurements plotted as a scatterplot.
One important thing to keep in mind is that the numbers we extract here are just estimates. As we dive into the settings of formants, you’ll see how tweaking the parameters will cause the measurements change. As always, estimation can be prone to error, but the better the sound quality, the more confident you can be about your data. For this reason, it’s good to get the best quality audio you can while minimizing background noise.
To view formant estimations, you can turn them on like you did with pitch: Formant > Show formants.
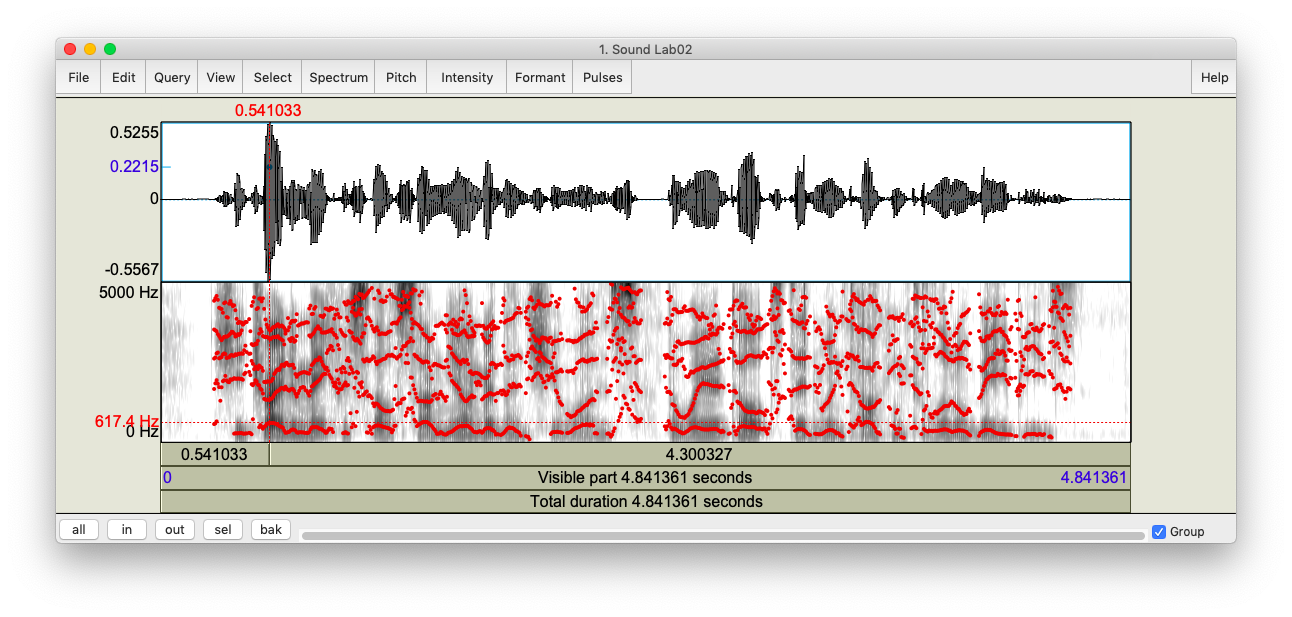
This will display formant contours, drawn as red and pink speckles, as in Figure 15. Odd numbered formant measurements (F1, F3, F5) are in red and even numbered ones (F2, F4) are in pink. The estimated measurement in Hz at the point where the cursor is is on the left, since it’s on the same Hz scale as the spectrogram itself. Right off the bat, we can extract some of these formant estimations in a similar way that we did the pitch. You can just put your cursor wherever you want, and it’ll show the value on the left.
An important thing to note is that the value you see on the left is not necessarily the estimated formant measurement: it’s simply how high within the spectrogram I clicked. You can see this by clicking around arbitrarily in the spectrogram and you’ll see the red number change. This is an important feature because it allows you to take manual measurements of formants, regardless of what Praat has estimated. The issue with this method is that it’s slow and essentially impossible to replicate because of its subjectivity. However, it’s a good feature to be aware of.
Instead, what you may want to do is to rely on Praat’s estimated values rather than clicking close to it. To extract just the lowest formant, F1, which corresponds to the height of the vowel, click where in the recording you want the measurement (i.e. where horizontally, which corresponds to time), and then go to Formant > Get first formant (Figure 16).
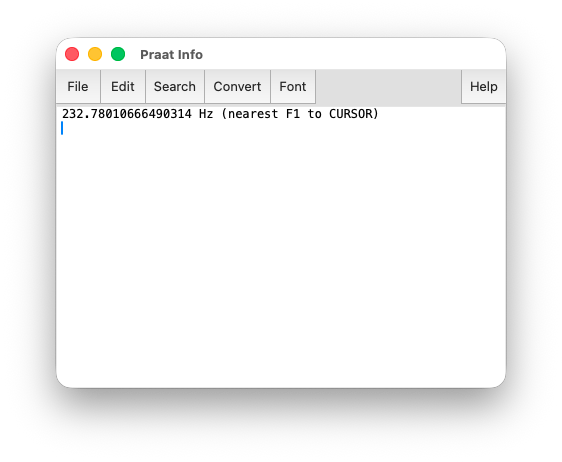
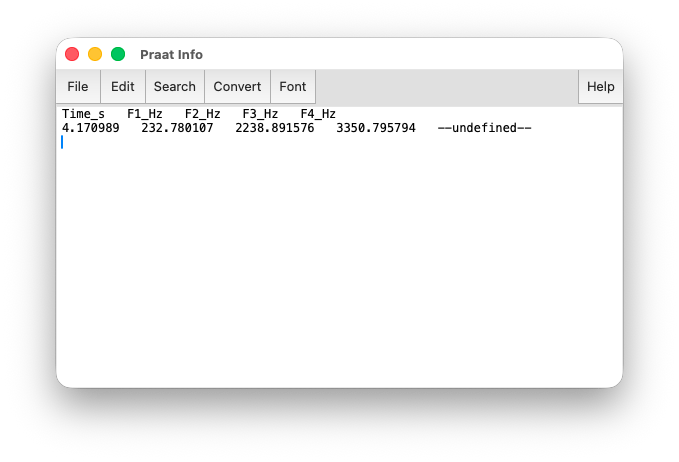
As always, it’s worth the time to learn the keyboard shortcuts. In this case, you can do the same thing by hitting F1. A window will pop up that shows you what the formant estimation is. You could do the same thing individually for F2, F3, and F4, but it might be easier to just click Formant > Formant listing instead, which will give you all of them at once. It’s in a probably-poorly formatted table (Figure 17), but this can be easily copied over into Excel if you want.
Now, I mentioned before that you can change Praat’s parameters for formant extraction. Not only can you, but you actually should. People’s vocal tracts are different lengths, and you can get better estimates if you adjust the settings appropriately. To adjust the formant parameters, go to Formant > Formant settings….
You’ll be presented with a window that looks like Figure 18.
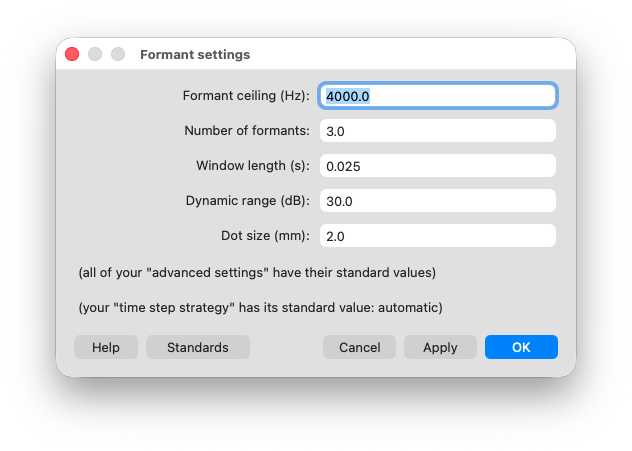
The main two parameters that you might want to change are these:
Formant ceiling (Hz): By default, Praat will look for formants that are less than 5500Hz, which is the default for a female voice. For male voices, it’s recommended to switch this to 5000 Hz. For very deep voices, I’ve had success switching to 4500Hz and for very high voices, I’ve done 6000Hz. Generally, I’ve seen people increment this parameter by 500Hz, but you’re welcome to use whatever number you want (5250Hz, 5100Hz, 5837Hz, whatever).
Number of formants: Within the range that you specify, Praat looks for five formants by default, F1 through F5. You can change this too, but you may want to adjust the max Hz accordingly. For male voices, I’ve had success using 4 formants at 4000Hz, but that was a judgement call on my part.
If you can see both the Formant settings window and the TextGrid window at the same time, click on Apply and watch the red speckles adjust according to the parameters. The goal is to get the red speckles to align with the dark horizontal bands on the spectrogram as closely as possible. Consider this trio of images
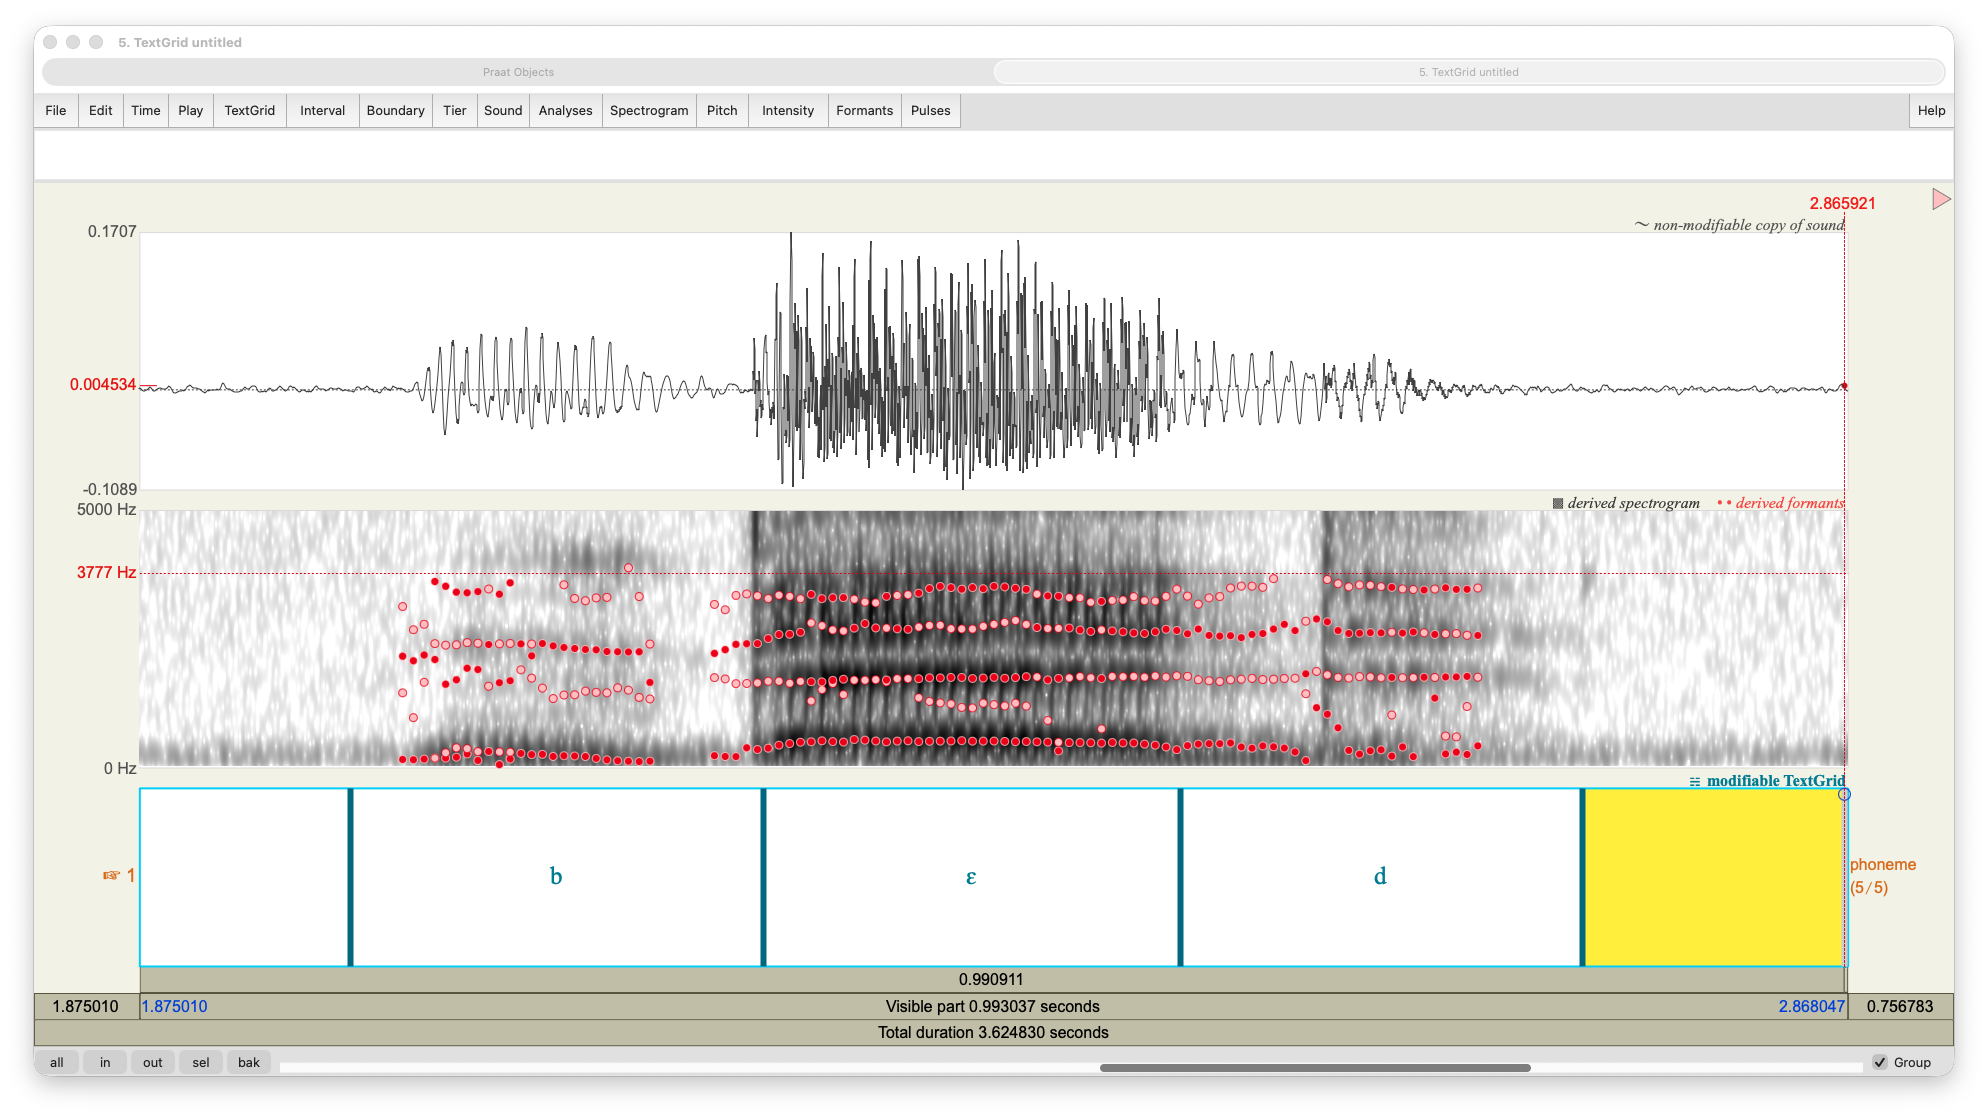
This image shows a spectrogram of me saying the word bed. This version doesn’t have the red speckles because I want you to notice the roughly four horizontal bands going across the vowel. That’s what we want our red speckles to align with. In this case, the formants are relatively level, meaning they don’t move up or down across the duration of the vowel, which makes it easier to get the red speckles to align.
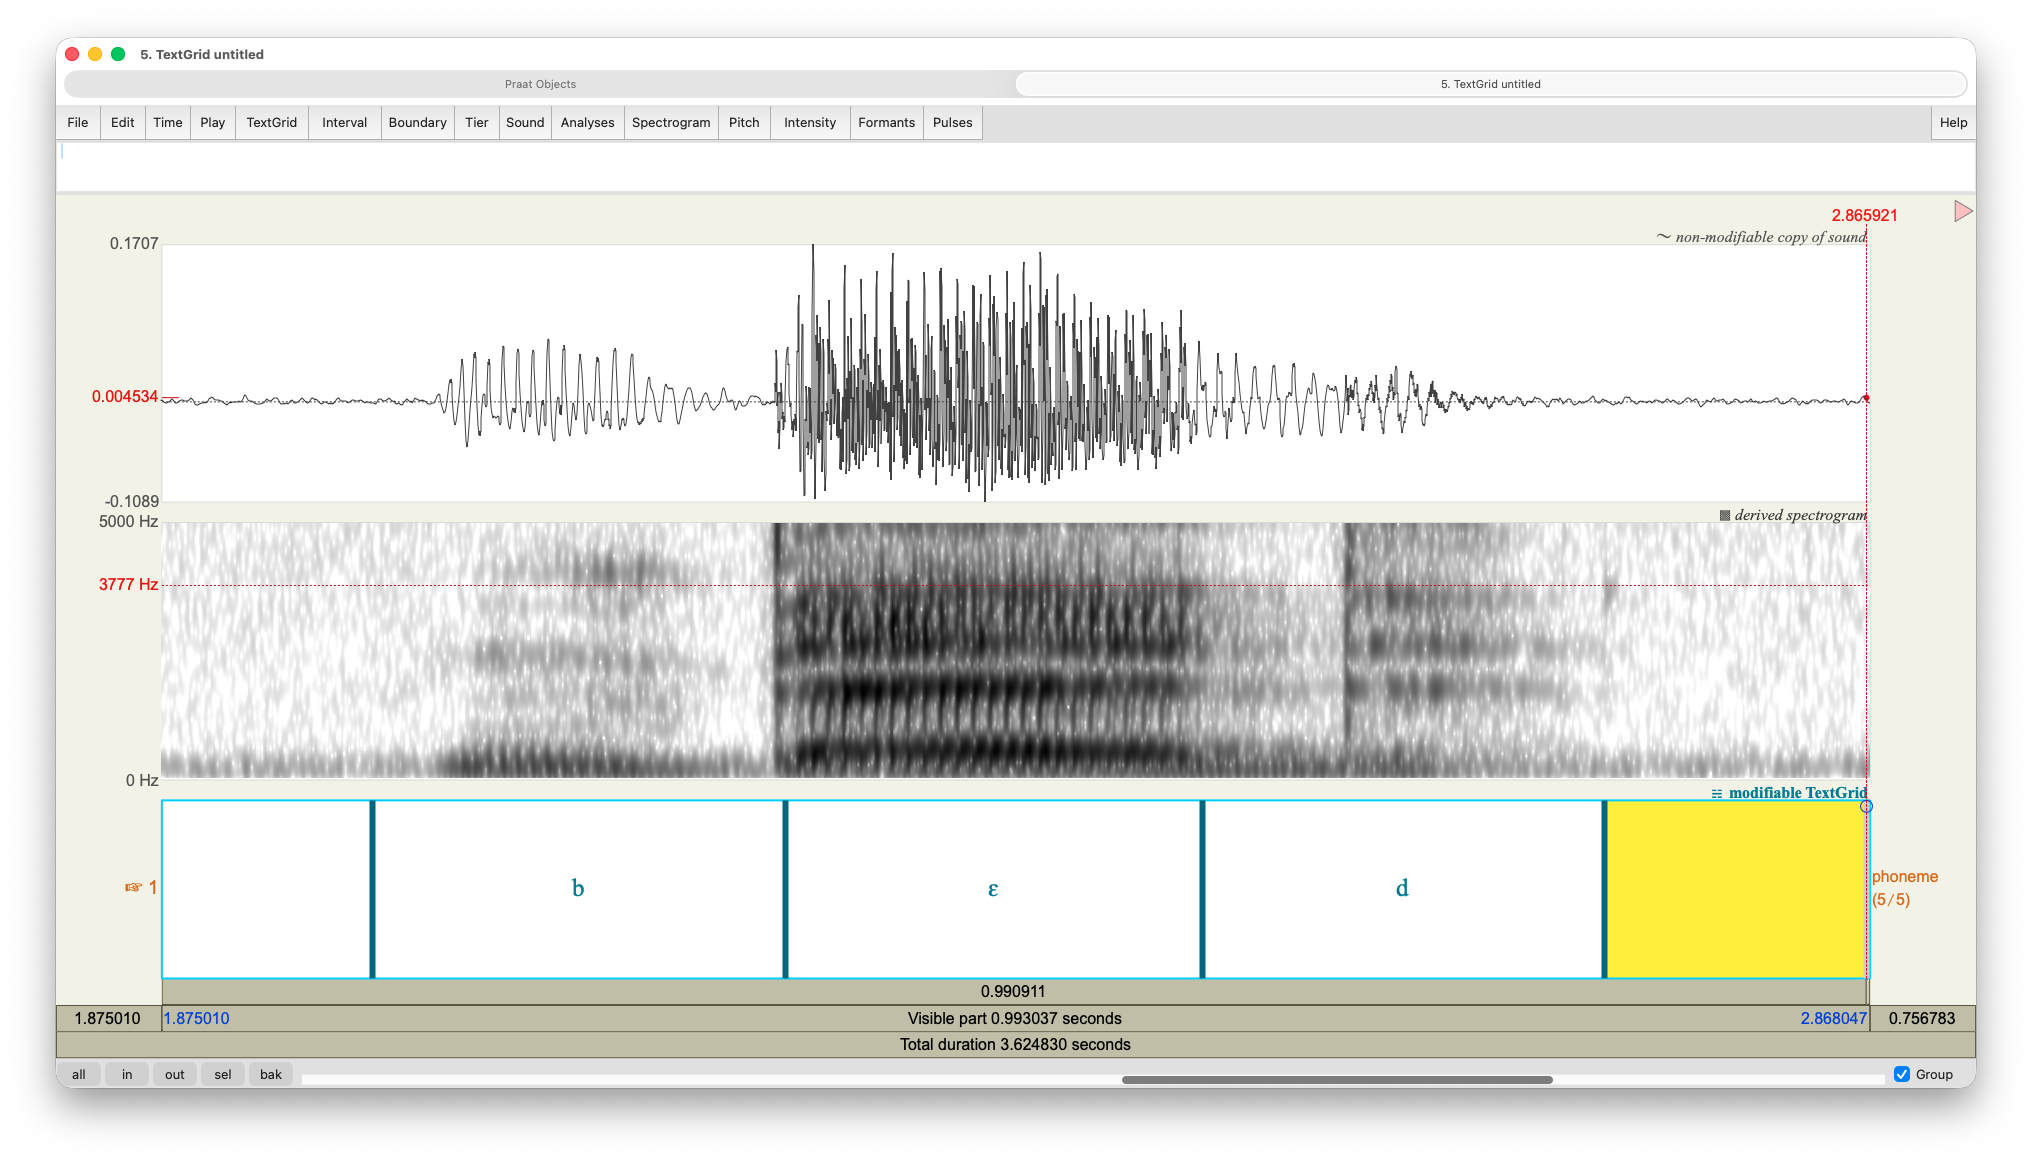
In this version of the plot, I’ve used appropriate settings, a formant ceiling of 4500Hz and four formants. Notice that in the vowel portion of the recording, the red speckles align nicely with the horizontal bands. This produces pretty good estimates of the /ɛ/ vowel. Extending into the consonants, the formant estimates look a little messy, but we don’t care about those, so it’s no big deal.
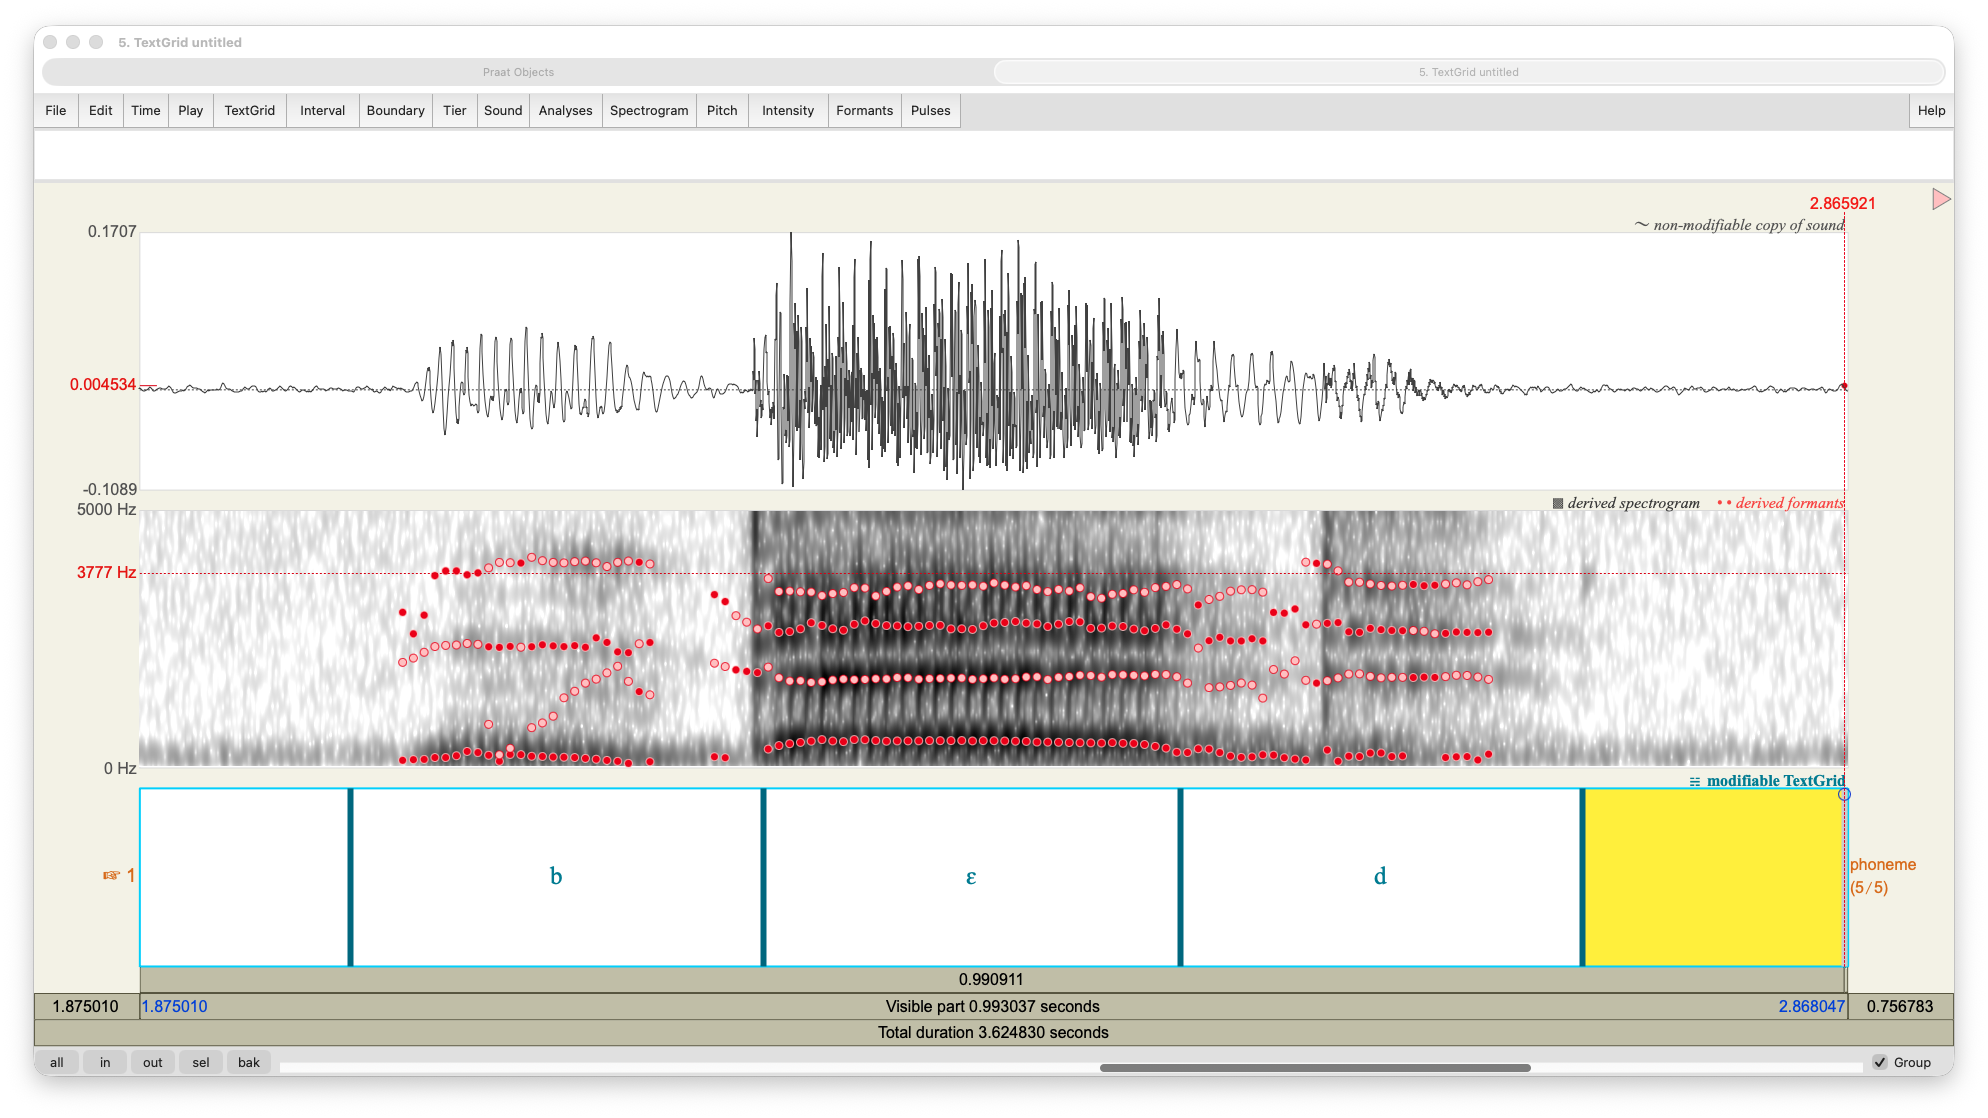
In this version of the plot, I’ve told Praat to look for five formants under 4000 Hz. Some of the red speckles look alright, but crucially, in the middle of the vowel we have a sort of phantom formant that Praat thinks it found. There is a short stretch of pink speckles between the lowest two formants. Since Praat was forced to look for five in a relatively narrow window (0–4000Hz), an extra one was thrown in there.
Adjust the formant parameters and look at the effect that it has on the red dots. Zoom in on
In my recording, I found a
I then went to the word talking for the /ɔ/ token. With the default settings, F1 was 635Hz and F2 was 1056Hz. When I switched to 4000Hz and 4 formants, F1 was 633Hz and F2 was the same. In this case, it didn’t change much. However, when I switched to the default for women’s voices (5500Hz and 5 formants), F1 was quite a bit higher at 683Hz and F2 was 1048Hz. As you can see, making these methodological choices is important because they can have outcomes on your results!
For /u/, this sentence happened to not have any /u/, /ʊ/, or /o/ strangely enough. However, keep in mind that /u/ has a high F1 and a low F2, so Praat often interprets the two as a single formant. That will take some additional adjusting to make sure Praat gets both of them.
If you are interested in plotting your own vowels, it can be a fun exercise to manually extract formant measurements and creating a scatterplot. To do this, you’ll want to make a recording of yourself saying all the English vowels.
Since some consonants (like /j/, /w/, /l/, /ɹ/, and nasals) can influence formants, it’s best to pick words that have the vowel at the end of the word, or before voiced stops (/b/, /d/, /ɡ/), fricatives (/v/, /ð/, /z/, /ʒ/), or affricates (/dʒ/). You can try a set of words like bead, bid, bade, bed, bad, pod, pawed, bud, bode, hood, booed or something like that. If you have the time, you can get multiple instances of the same vowel (bee-heed-ease, bid-dig-iz, stay-age-daze, etc.) so that you can see a cluster.
For each word, find the temporal middle of the vowel. By that, I mean try to click right in the midpoint between the end of the previous consonant (if any) and the start of the next consonant (if any). Here is an example of me saying bed with my cursor right in the middle of the vowel. (You don’t need a TextGrid to do this task, but I have one here for demonstration purposes.)
Alternatively, you can pick a portion of the vowel that is relatively steady. In the image of the word bed above, the formants were relatively stable. Diphthongs like
Find the F1 and F2 of each vowel and save that information into a spreadsheet. Using Excel or other software, you can then make a scatterplot. You’ll want to put F2 on the x-axis and F1 on the y-axis. You’ll also need to flip the direction of both axes so that the origin is on the top right corner rather that the top left. You could also plot it out by hand on graph paper. You could also use this online tool. Unfortunately, it’s outside the scope of this workshop to show you how to make this plot.
There are some things to consider when looking at formant measurements.
Everyone’s vocal tracts are different, so there is no “correct” formant measurement for any vowel for any dialect. Taller people often have longer vocal tracts, so they tend to have lower formants since longer things create lower sounds (think of bass guitars, saxophones, or pipe organs). The opposite is true for shorter people. And there are of course other factors that go into a person’s formant measurements. So, if you get someone’s formant measurement and it’s very different from your own, that’s fine. When it comes to formants, it’s all about their position relative to others rather than the exact measurements.
Extracting formants is error-prone. For one, try clicking in the same place twice and notice the red number above the spectrogram change, even by a small amount. It’s basically impossible! Then try extracting formant measurements from very close places and you’ll notice that they too are a little different each time. And that’s assuming the parameters are good. As we saw above, small adjustments to the parameters can produce poor results. So, if you end up with really wonky measurements, such as a
goose vowel that is way lower or fronter than eventrap , don’t think it’s because of some unique dialect feature you have. It’s more likely that you got bad measurements. That’s why I recommend getting at least three words for each vowel so that you don’t rely on a single measurement.There are ways of automating formant extraction. Unfortunately, they involve writing a script in Praat’s unique scripting language. It’s far beyond the scope of this tutorial, but if you are interested in how that works, you can check out my tutorial on that here. There is also software that you can download that does that too here but it takes a bit of computer know-how to get it to work. I was hoping to have an online tool ready to demonstrate for this workshop, but I just didn’t quite get it ready on time. Please stay tuned for software called VoxHumana that I’ll be announcing soon!
For now, that’s all we’ll do when it comes to formant measurements. I encourage you to get familiar with the measurements in your own speech, to take measurements in Praat, and to learn to “read” vowel plots in published academic work. I’ve seen so many vowel plots that I can instantly point out interesting things about a person’s speech and can often identify what variety of English they have just by their vowel plot alone.
Look at my vowel plot and see if you can identify some things about my speech. Can you tell where in the US I’m from from that plot alone? Here it is repeated for convenience.
I have a detailed analysis of my own idiolect here, but here are some highlights:
- I don’t merge
lot andthought . Phonetically, they’re quite close, but they’re firmly distinct in my speech. This rules out a lot of places like the West and parts of Pennsylvania and New England. - My
trap vowel is not especially lowered/centralized, which means I don’t have the increasingly common (in the US) so-called California Vowel Shift. That means I’m not from the West and/or I’m not young and urban. - My
goose is somewhat fronted but not too much. That means I’m not from the West or South. It is fronted a little bit, so I’m not from the Great Lakes area.
It’s not super obvious from the plot, but I grew up in a suburb of St. Louis, Missouri!
6 Examining Voice Onset Time
We’ll now move onto a closer examination of certain consonant sounds. We’ll look at voiceless stops/plosives: /p/, /t/, and /k/. Across the English-speaking world, these sounds are often aspirated, which means there’s a small puff of air that comes out as part of the consonant before the vowel sound. You can feel this for yourself if you hold a hand in front of your mouth as you say words like pop, top, and cop. In IPA, we transcribe this aspiration with a little superscript h, as in [pʰ], [tʰ], [kʰ].
Not all languages have aspiration in these sounds. If you’ve ever learned a language like Spanish, you probably had to learn to produce non-aspirated versions of these in words like para, tomar, and cama. Some English dialects have less aspiration than others. Notably, South African English tends to have less aspiration than other varieties. Other varieties that have more direct influence from other languages, like Nigerian English, also tend to have less aspiration.
We can measure this aspiration with an acoustic measure called voice onset time (VOT). To examine VOT, we’ll need a recording of some consonats. Make a recording of yourself saying these words:
tack, soup, days, shoot, pad, dill, steep, sit, code, tab, bees, scope, kill, dice, bash, goes, bus, seep, cab, spit, peg, gas, shop, skill
Remember to save the file to your computer so you can come back to it later! If you’re following along asynchronously, it might be worth it to also make a word-level transcription of the file.
6.1 A brief explanation of stops
A stop consonant has three main parts. Figure 19 shows these three parts.
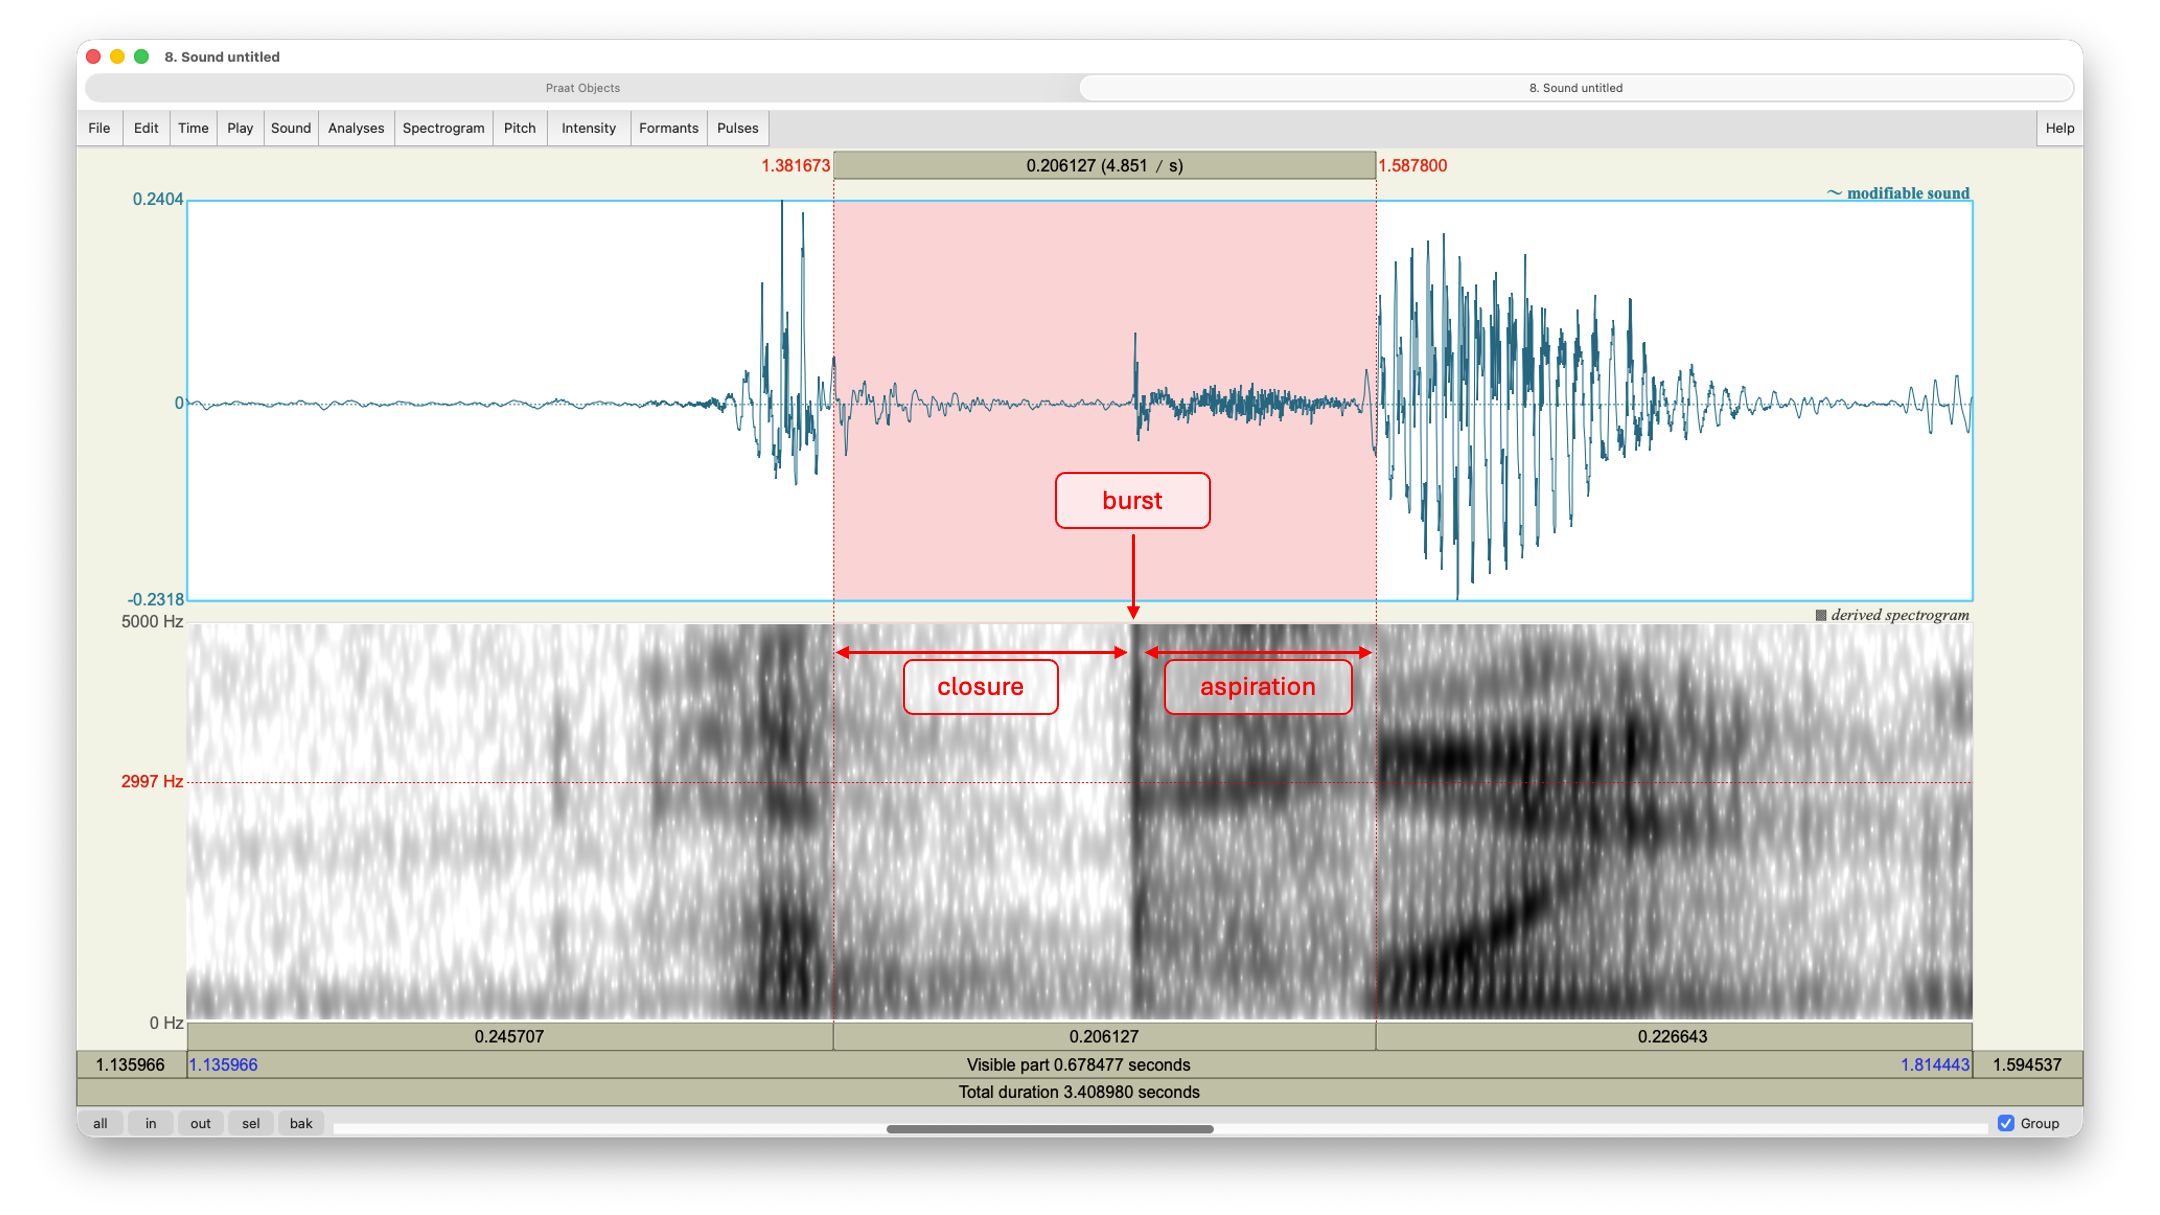
First is the closure. This is when the articulators are closed and there’s no air coming out of your mouth. In a bilabial sound like /p/, the two lips are closed. In a alveolar sound like /t/, the tongue is pressed against the alveolar ridge (the gums surrounding the teeth). And in a velar sound like /k/, the back of the tongue (i.e. the dorsum) is pressed against the soft palate (i.e. the velum). Since for a brief period there is no movement in the vocal tract, there is not a lot of sound going on. The closure period is visible in the spectrogram usually as white rectangle. There might be some bleed-over from the left side to the right, partly depending on the echo in the room you’re in. In the wave form, the closure period is pretty flat. In Figure 19, the closure period is 114ms long.
Next is the burst. This is when the articulators separate and the pressurized air that built up during the closure finally releases. This is a very short, but abrupt portion of the stop. In Figure 19, the burst is something like half a millisecond long. It is visible in the spectrogram as a thin, vertical bar of black immediately after (and in stark contrast to) the closure. It’s also visible in the wave form as a sudden spike. In some cases (most commonly with /k/) there may be two bursts. /t/ usually has the loudest burst.
Finally is the aspiration or the VOT. This is the period of time between when the articulators separate and when the vowel starts. During this time, air is coming out of the mouth in an /h/-like sound. It’s visible in the spectrogram as a gray rectangle with some indications of formants as the tongue moves into position to start the vowel. In Figure 19, F3 is especially prominent during the aspiration. It’s visible in the waveform as an irregular, relatively short series of movements in contrast to the spike in the burst and the regularity of the following vowel. In Figure 19, the aspiration is about 89ms long. Some people have rather prominent aspirations, and it can vary depending on the sound and the emphasis given to the word.
Not all parts of a stop will be visible all the time. If a sentence or utterance starts with a stop, it’ll be impossible to see when the closure starts. If a stop is followed by another consonant or is at the end of the word, the aspiration and maybe even the burst may be missing entirely.
Take half a minute or so and see if you can identify the three parts of a stop in some of the words in the wordlist you just read. The words have been carefully selected so that the three parts are prominent in some of them and less prominent in others.
6.2 Measuring VOT
Fortunately, unlike formant measurements, measuring VOT is pretty straightforward. It’s just a simple duration measurement. It starts at the end of the burst and ends when the vocal folds start vibrating. In Praat, we can measure duration by clicking and dragging in the spectrogram or waveform. A pink box appears with a number above it. That’s the duration in milliseconds. The tricky part of measuring the VOT is making sure you get the precise start and precise end.
The start of the VOT is a little easier. Zoom in so that you’re mostly only seeing the aspiration. Find where the burst ends by looking at where the vertical bar from the burst ends. That should align with a change in the waveform. In Figure 20, the pink starts right where I think the VOT starts. The waveform before it is taller and after it matches the rest of the aspiration.
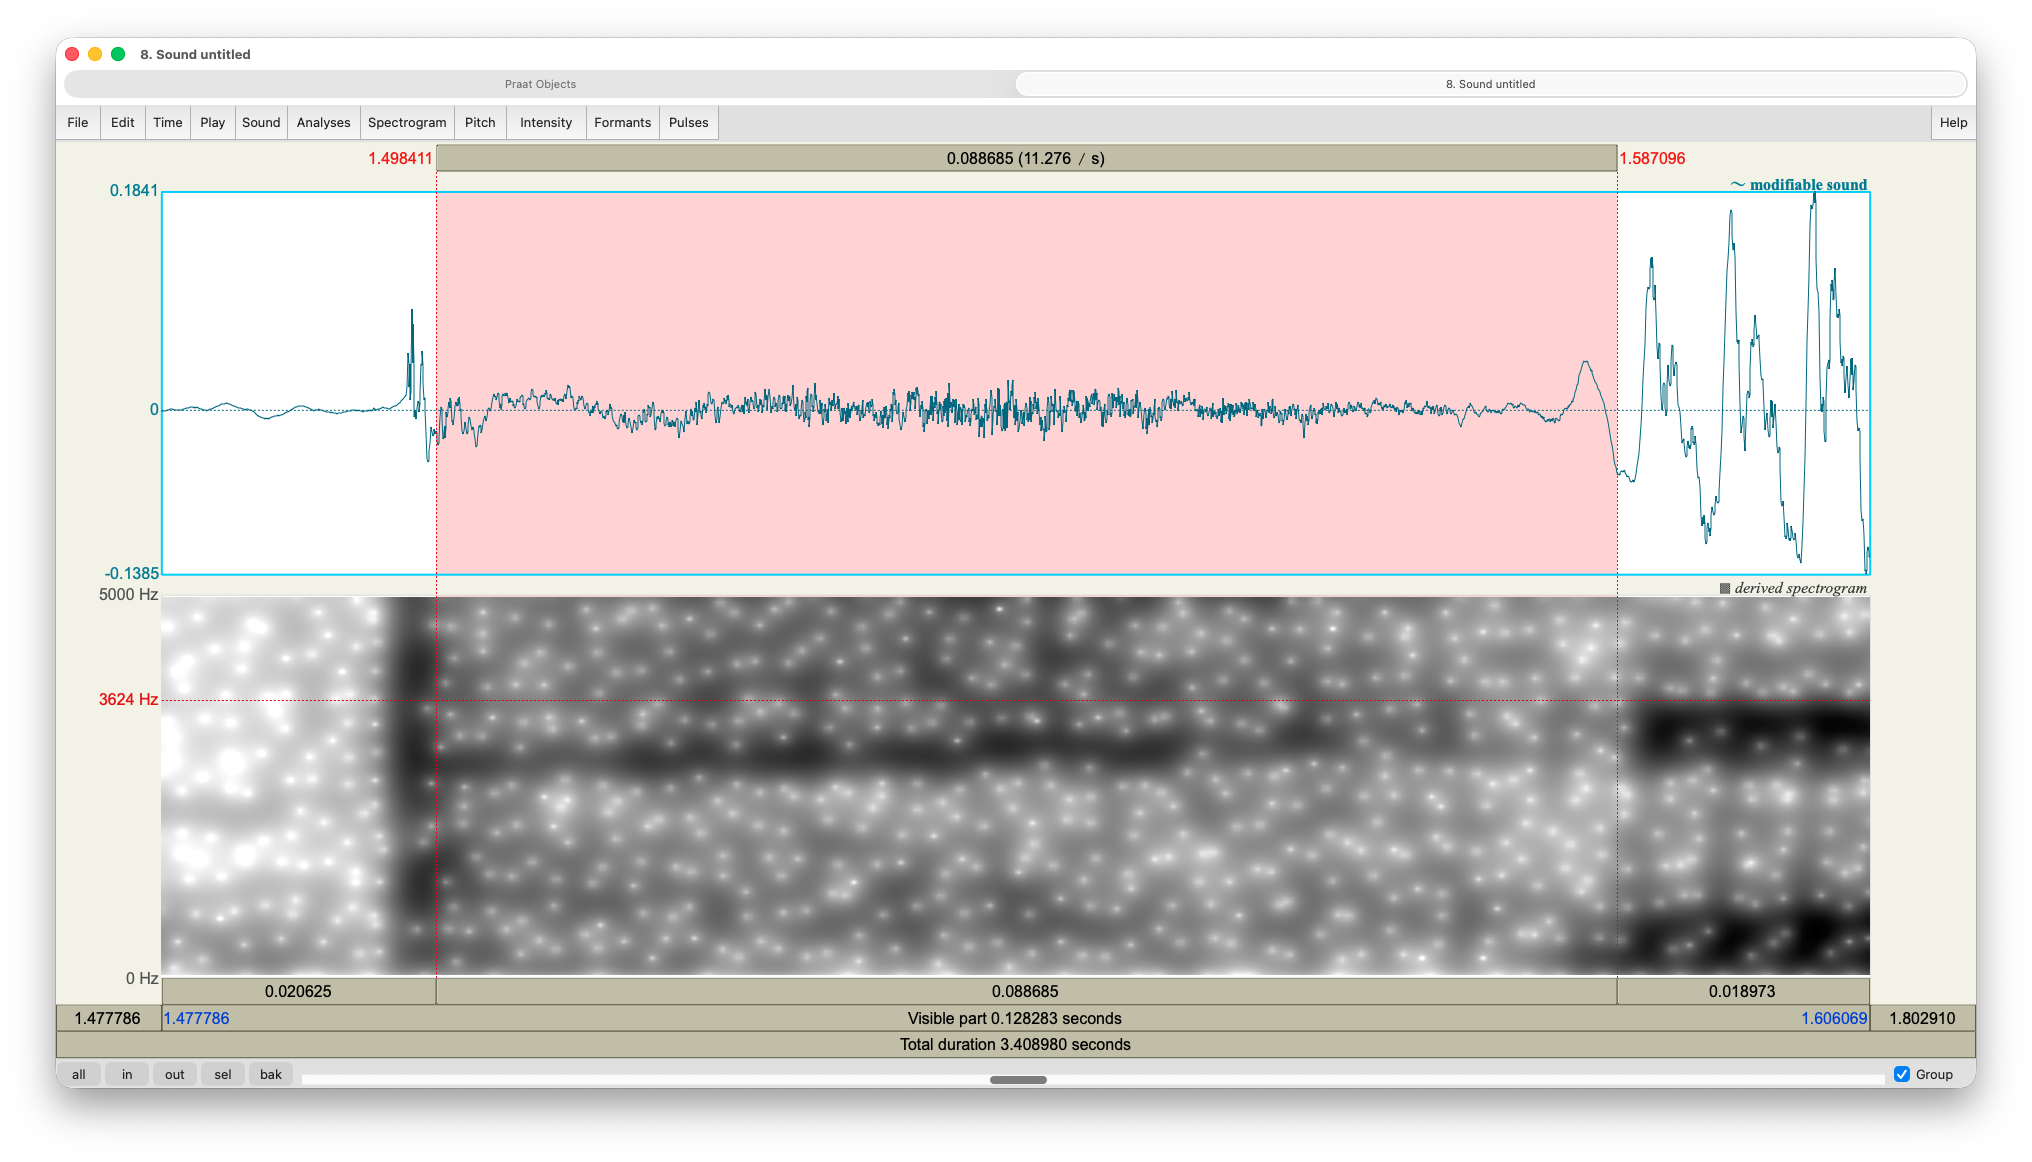
Finding where the vowel starts is a bit trickier. The key is the idea of periodic movement. Vocal folds vibrate with regularity and that is visible in both the spectrogram and the waveform. In the spectrogram, vowels have vertical striations that correspond to portions of the wave form that are high. These both correspond to when the vocal folds are open. If you look at the wave form of a vowel, you can see that there’s often a pattern that repeats. In Figure 20, you can see it repeating about three times. VOT ends when that period movement begins. You can use the spectrogram as a guide as well. Whenever you start to see multiple horizontal bands of black, that’s a good signal that the vowel has started.
Unless you’re doing really intense phonetics, it’s probably not necessary to spend a lot of time getting a super precise measurement, but it’s good to know what it takes to do it well.
As it turns out, VOT is not always there. In the following exercises, you’ll explore VOT and its variation in your own speech.
One of the most canonical place that we get aspiration in English is in words where the first letter is a voiceless stop and the first syllable is stressed. Take a look at your aspiration in the following words:
tack, pad, code, tab, kill, cab, peg
See if you notice a difference in the length of the VOT between /p/, /t/, and /k/.
Here are the VOT measurements in my recording:
| word | sound | VOT (ms) |
|---|---|---|
| pad | /p/ | 71 |
| peg | /p/ | 83 |
| tack | /t/ | 56 |
| tab | /t/ | 101 |
| code | /k/ | 117 |
| kill | /k/ | 108 |
So, at least in my speech, the /p/s tend to have a shorter VOT than the /k/s. But, /t/ was variable. I’d have to collect some more data to see if this generalizes across my speech.
During this discussion of VOT, we’ve only talked about voiceless stops. What about voiced stops /b, d, ɡ/? We’ll, let’s explore those a little bit. Calculate the VOTs in the first sounds of each of the following words:
days, dill, bees, dice, bash, goes, bus, gas
As a spoiler, the VOTs here may be very short or nonexistant. You may need to zoom waaay in to get the duration to appear. Try your best at taking these measurements.
Here are my measurements for these words. As expected, the VOTs are short or nonexistant.
| word | sound | VOT (ms) |
|---|---|---|
| bees | /b/ | 0 |
| bash | /b/ | 7 |
| bus | /b/ | 5 |
| days | /d/ | 6 |
| dill | /d/ | 12 |
| dice | /d/ | 9 |
| goes | /g/ | 12 |
| gas | /g/ | 9 |
It might be the case that /b/ has the least amount of aspiration.
So what we’ve learned so far is that word-initial voiceless stops tend to have quite a lot of aspiration and word-initial voiced stops tend to have very little. This shows that the difference between “voiced” and “voiceless” stops is not just about voicing—it’s also about aspiration.
Let’s look at voiceless stops in a specific context though and see if we can mess with our perception.
In this task, we’ll measure aspiration in voiceless stops that appear after /s/ near the beginning of the word. Gather VOT measurements in the voiceless stops in the following words:
steep, scope, spit, skill
Before you do so, what do you expect based on what we’ve seen with voiceless stops?
Here are my measurements.
| word | sound | VOT (ms) |
|---|---|---|
| spit | /p/ | 4 |
| steep | /t/ | 18 |
| scope | /k/ | 17 |
| skill | /k/ | 7 |
Are these results surprising? Why are those VOTs so short?? The simple answer is: that’s just how English is! For whatever reason, English doesn’t have aspiration in voiceless stops after /s/. This is just part of the contextual variation that we learn as children. Adult learners of English have to consciously learn this pattern, and if you’ve worked with people whose first language isn’t English they you might hear them say words like sk[ʰ]ill or, in the case of my name, St[ʰ]anley.
The fun part about this is you can actually mess with with your perception. Take a word like spit. Highlight the entire word except for the s and play it. You might expect to hear pit, but what do you hear? Do you hear bit? Why is that??
It’s because we actually use aspiration as a cue for identifying the difference between voiced and voiceless stops more than actual voicing. In fact many of the so-called voiced stops are actually voiceless! (You can check some of the ones in the wordlist for yourself.)
Anyway, all this boils down to the unconscious patterns in VOT and its contextual variation in English.
If you want some additional practice measuring VOT, try looking at the word-final voiceless stops in the following words:
tack, soup, shoot, steep, sit, scope, seep, spit, shop
What do you expect to find? How are the results different than stops at the beginning of the word?
7 Center of Gravity
For our last use case, we’ll look at some other consonants in the same wordlist. Our focus is on sibilant consonants: /s/, /ʃ/, /z/, and /ʒ/.
To get some intuition of what center of gravity is, let’s focus on two sounds: /s/ and /ʃ/. Try saying see and she and focus on the consonants. You can try going back and forth between them smoothly: ssss-shhhh-ssss-shhhh. Auditorily, you may notice that the /s/ sound is higher-pitched and the /ʃ/ sound is lower-pitched. It’s not really clear what that pitch is (you can’t hum that “note”), but whatever that sound is is clearly different beween these two consonants.
What you’re hearing is operationalized as center of gravity (CoG). Articulatorily, what’s going on is that the area in the mouth that this sound is coming from is between the front of your tongue and the back of your front teeth. In /s/, the tongue and teeth are really close together, creating a really small space. Like we said already, small things create high-pitched sounds. In /ʃ/, the tongue is a little bit further back, which creates a larger area in the mouth, which creates a lower pitch. Sociolinguists have found that a higher /s/ sound is percieved by listeners to be more feminine.
Here’s an activity you can try to help you get a feel for what your mouth is doing when you say these sounds.
The high and low pitch difference between /s/ and /ʃ/ is important to how English speakers differentiate those sounds. In fact, the difference comes not just from the tongue but also the lips: most English speakers actually purse their lips a little bit when saying /ʃ/. In IPA, we represent this with a [ʷ] symbol: [ʃʷ]. What that does is actually increase the resonance chamber and brings the pitch down even further to help exaggerate the difference between the two.
Try saying she while smiling the whole time, paying attention to the CoG of the fricative. You might notice it’s a bit higher than if your lips are sticking out a little bit. Similarly, try putting your lips in position to say she but on the inside of your mouth say see. You might hear that that /s/ is now lower in pitch. If you’re really good, you can try all four: [s, sʷ, ʃ, ʃʷ].
So, how can we quantify this pitch difference? First, I’ll show you a sort of round-about way of doing things, which involves getting our hands dirty with Praat. Then I’ll show you the easy way of measuring CoG.
7.1 Changing the spectrogram settings
Let’s look at a spectrogram of an /s/ sound. If you have the wordlist from the previous section, find a good /s/ sound, perhaps in sit, and focus on that one word. I’ve got mine highlighted in Figure 21.
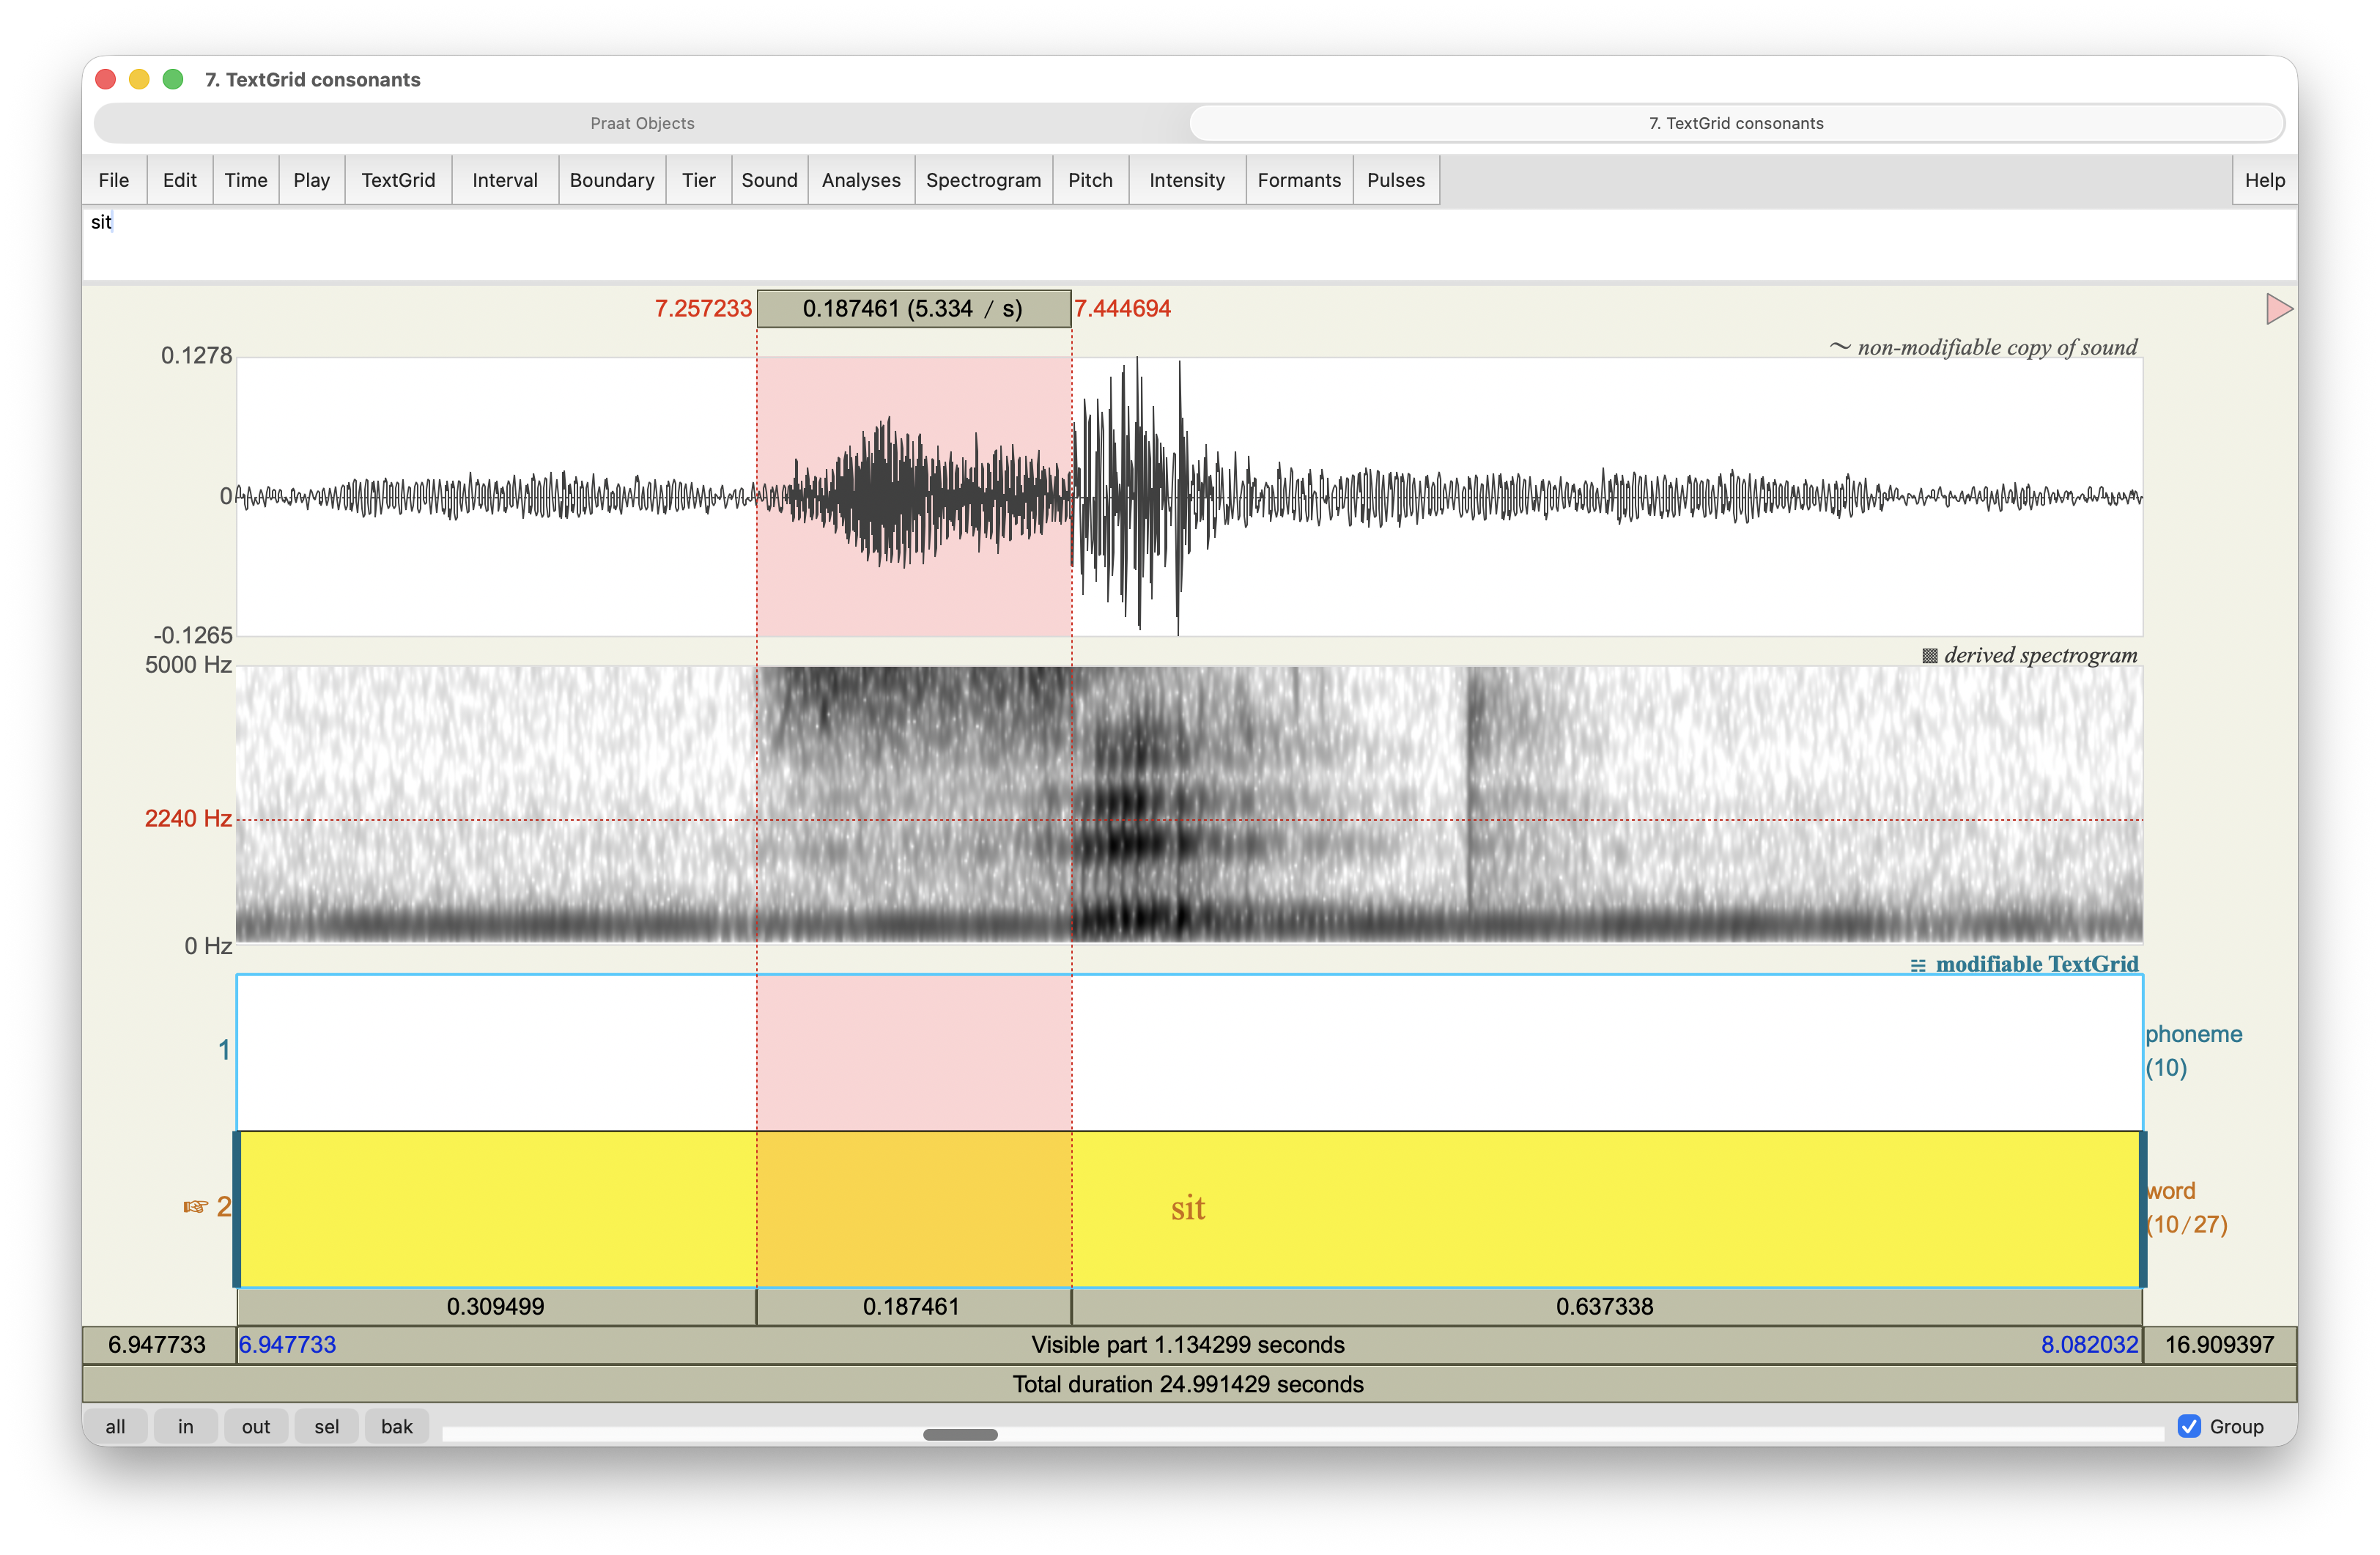
Let’s take a step back and think again about what the spectrogram shows. Along the x-axis from left to right, we have time into the recording. In Figure 21 mine goes from 6.94 to 8.08 seconds into the recording. Along the y-axis we have frequency in Hz, going from 0Hz to 5000Hz. By default, Praat shows up to 5000Hz because most of the information in speech that we use to perceive things is below that. However, /s/ is an exception.
Notice in Figure 21 that the /s/ (highlighted) has a fuzzy black portion near the top. That means that’s where the most concentration of energy is. (Never mind the persistent black band near the bottom of the spectrogram: I was not in a good recording location.) We can see if there is additional energy higher than that by changing the spectrogram settings.
First, go to Spectogram > Spectrogram settings…. You’ll see a window that looks like Figure 22.
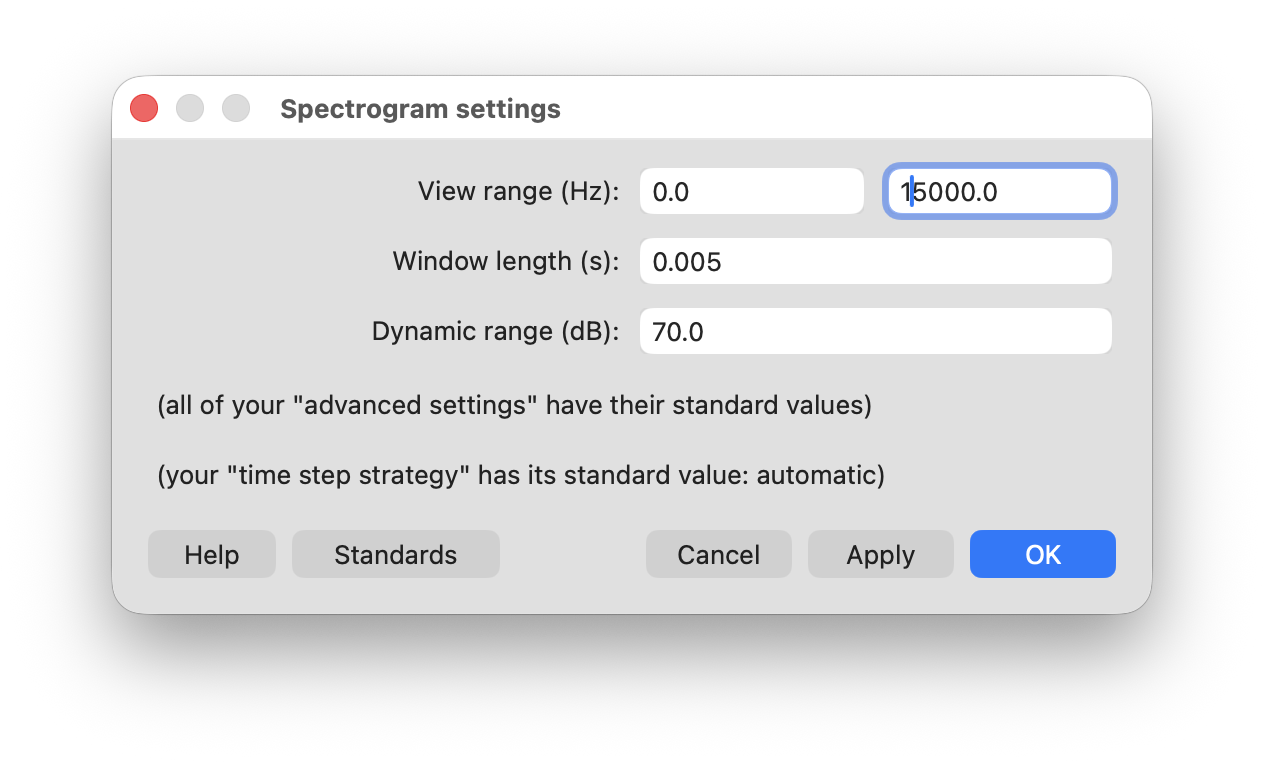
You should change one setting. Instead of the view range going from 0 to 5000, change it to going from 0 to 15000. Now look at my spectogram of sit in Figure 23.
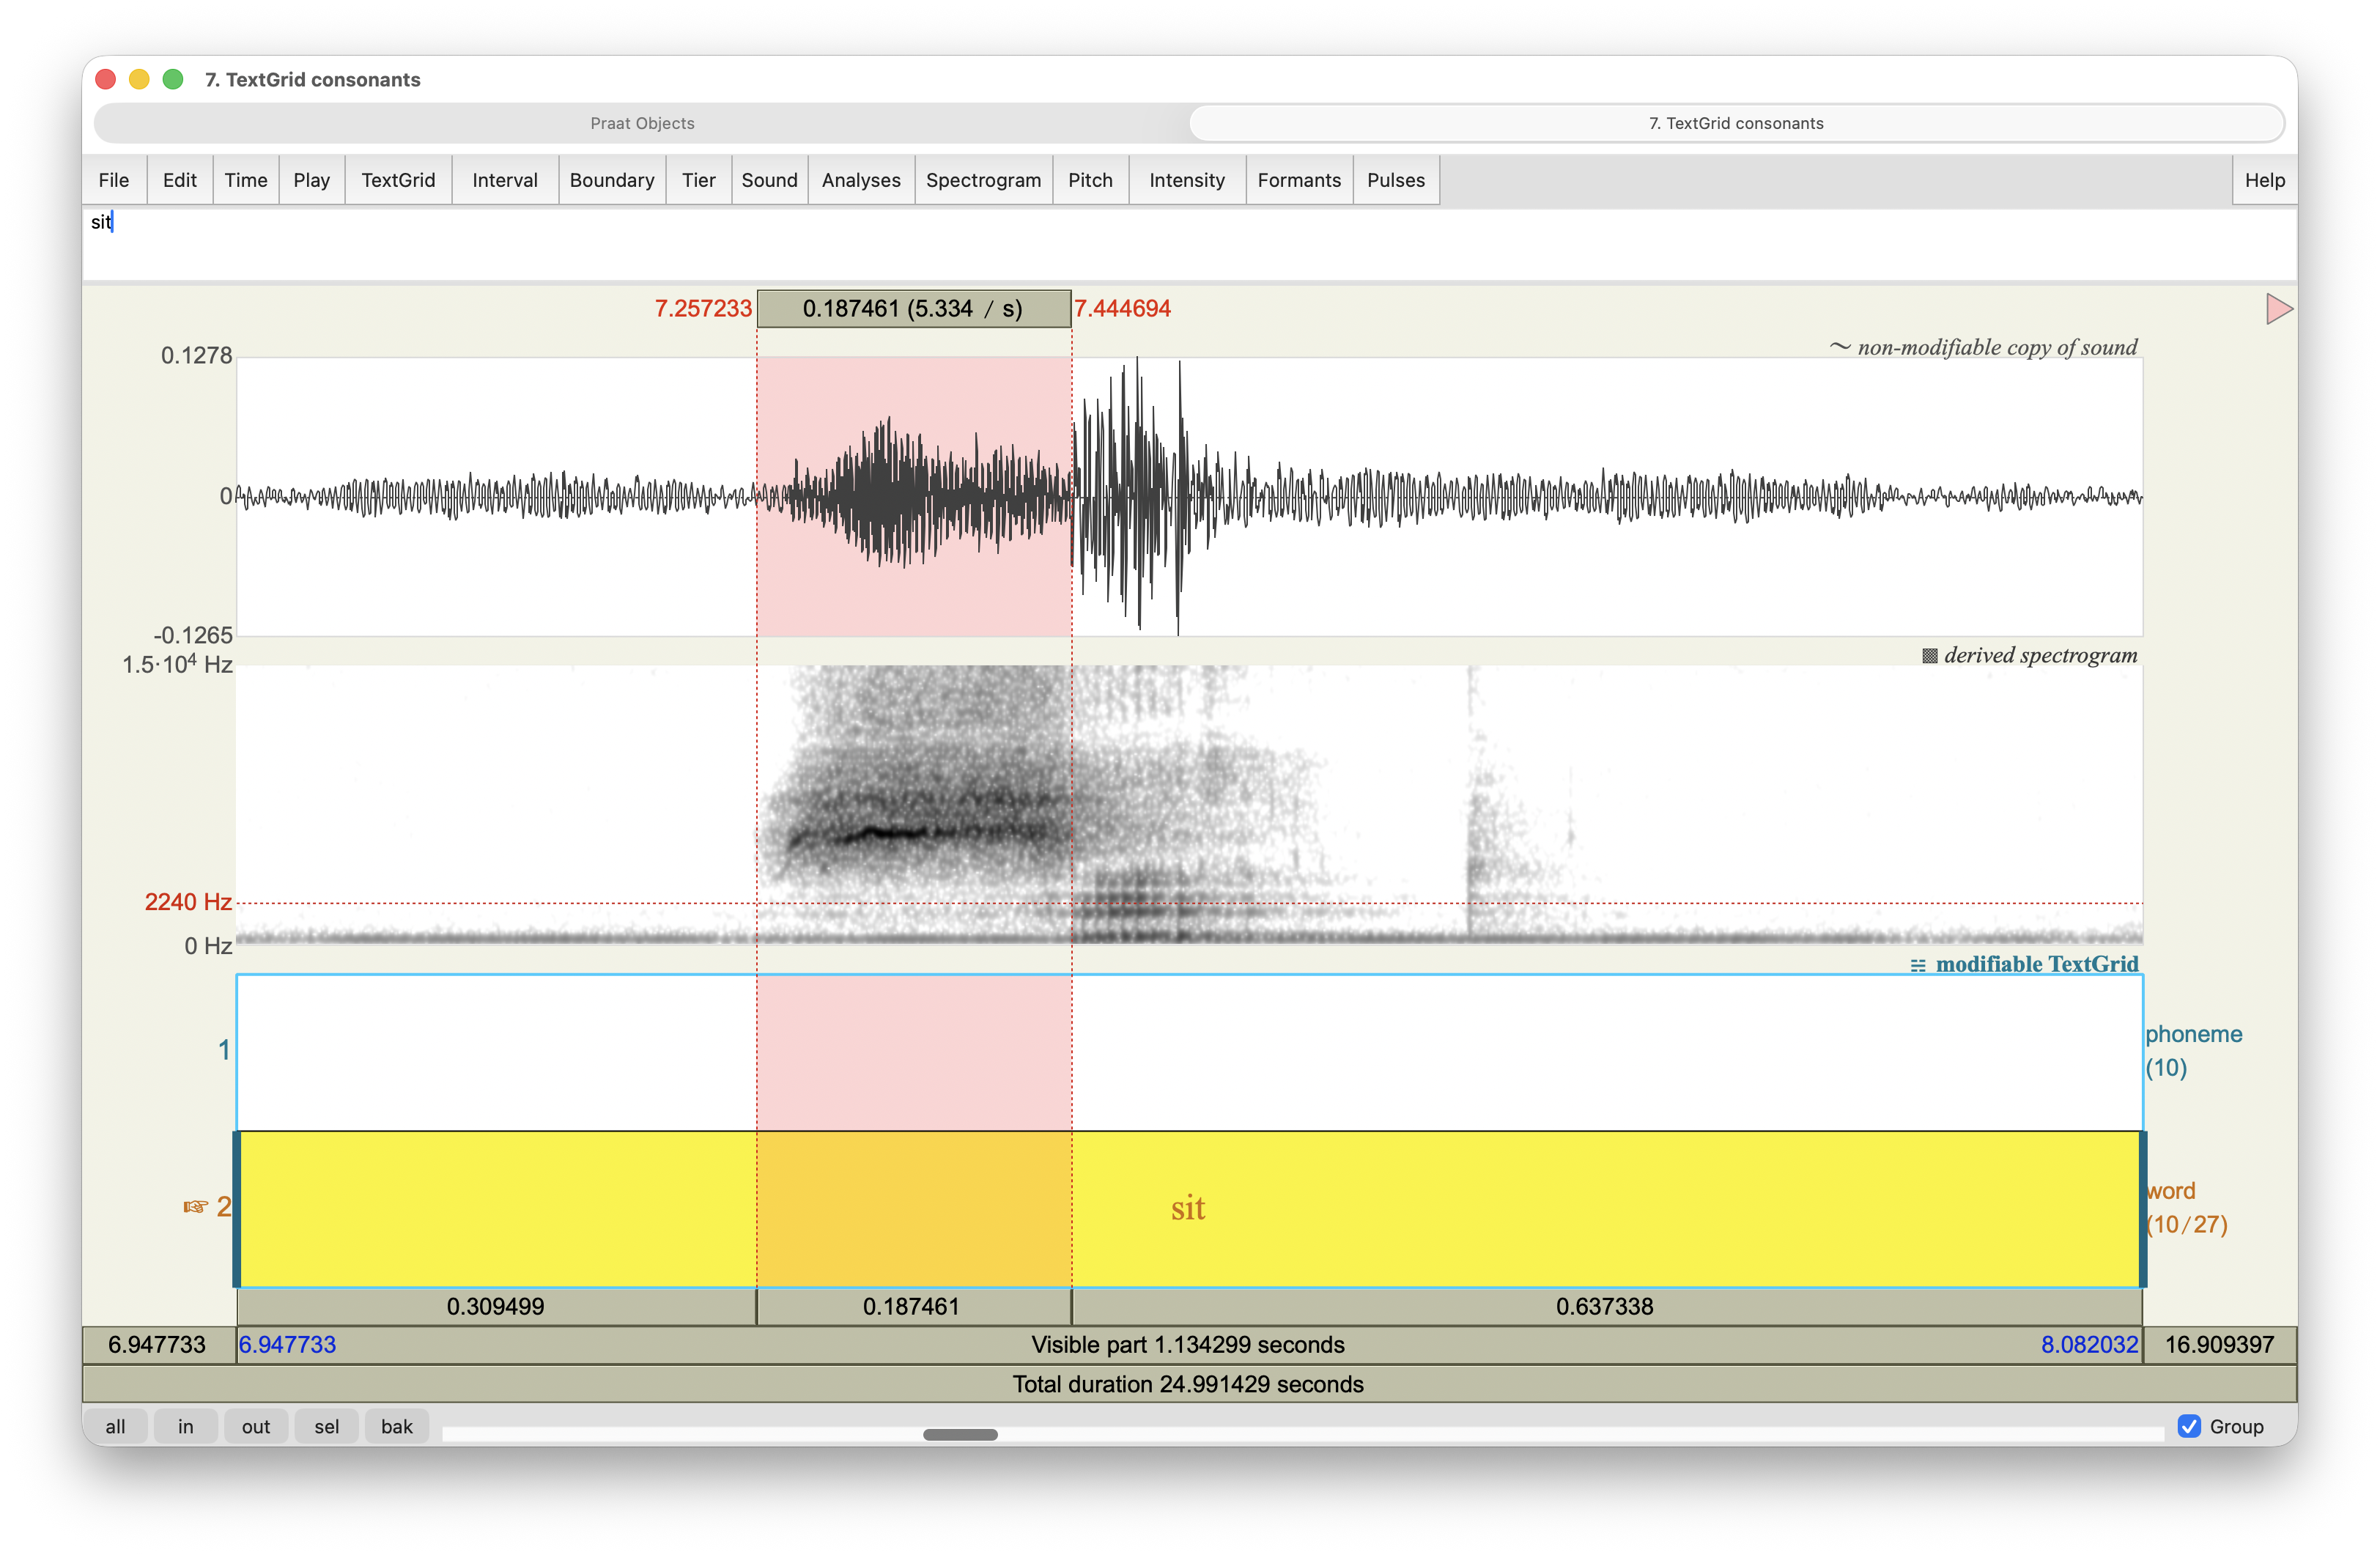
The y-axis has expanded to a much wider range. And look, there’s a lot of concentration of energy in the 5,000–10,000Hz range!
Now scroll over to a /ʃ/ sound as in bash. Here’s mine in Figure 24.
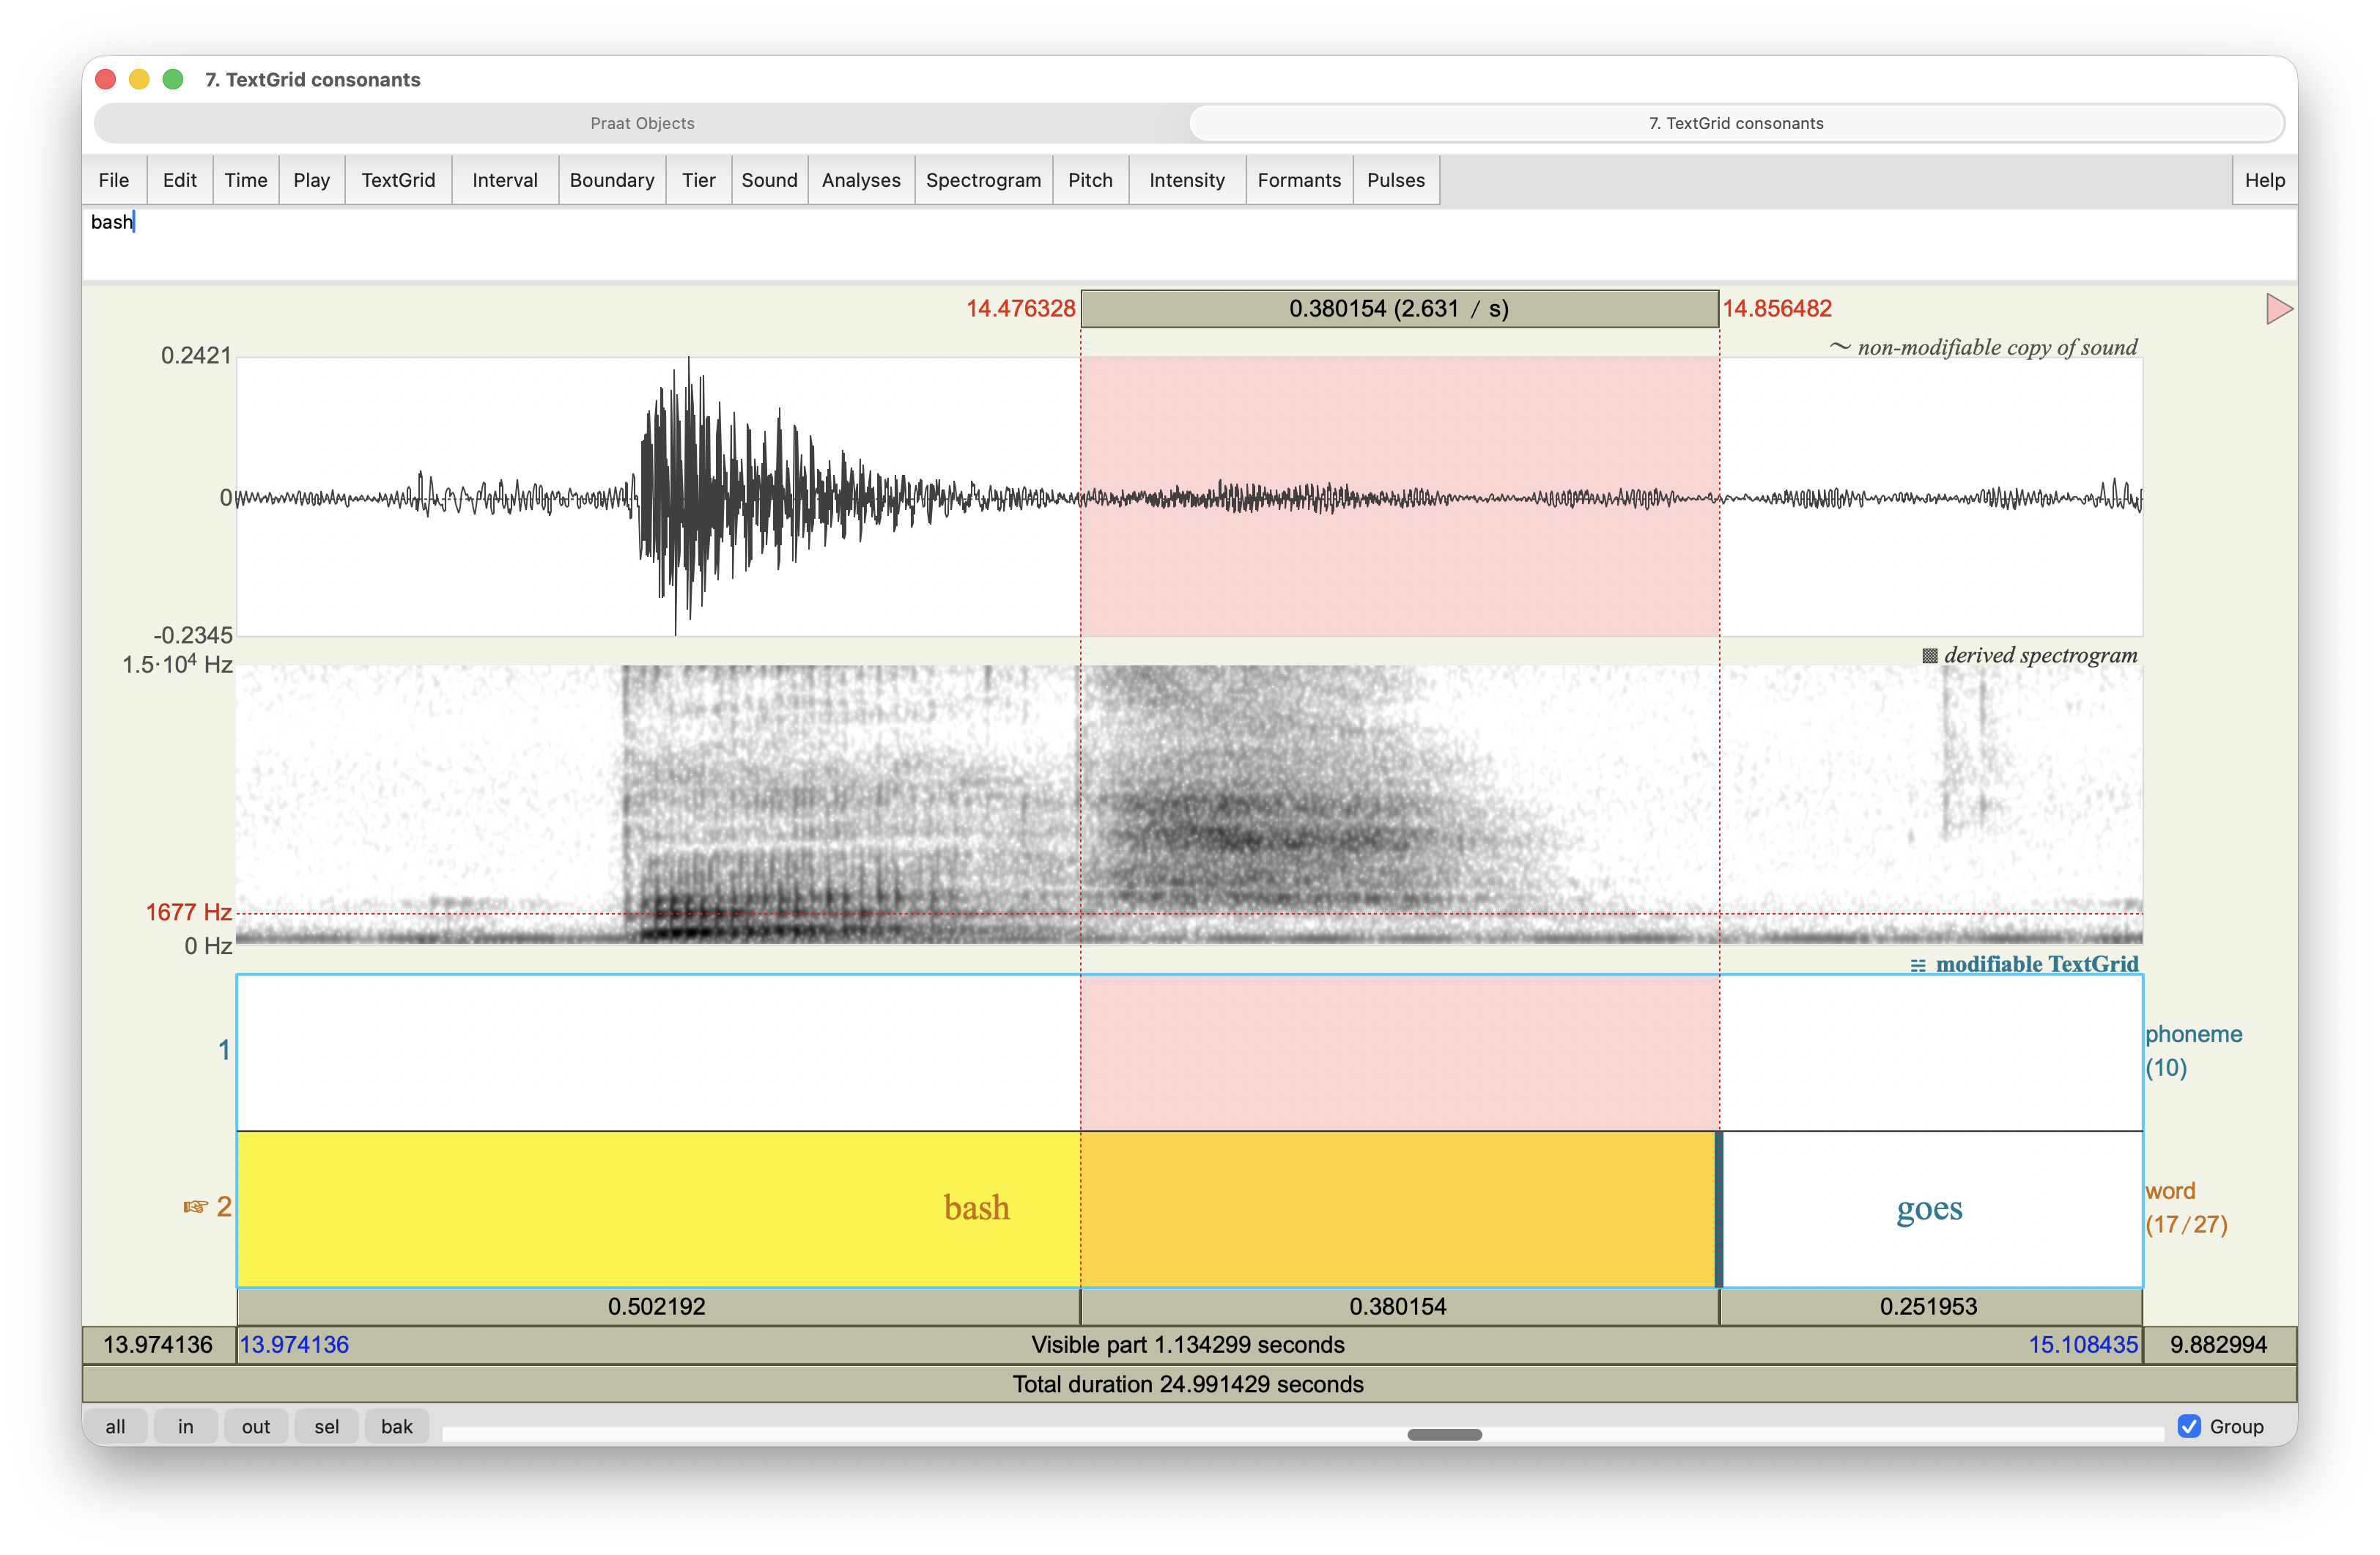
Notice that the darkest part is lower than 5000Hz. This is visual evidence for the lower center of gravity.
7.2 Viewing a Spectral Slice
So a spectrogram has lots of information across time. But what if you just wanted to view a slice of time? Praat offers a way to basically take a cross-section of a spectrogram so we can analyze it. This is called a Spectral Slice.
To get a spectral slice, find a fricative that you want to measure. Go to the middle of the fricative and highlight around 10ms. Here’s mine in sit:
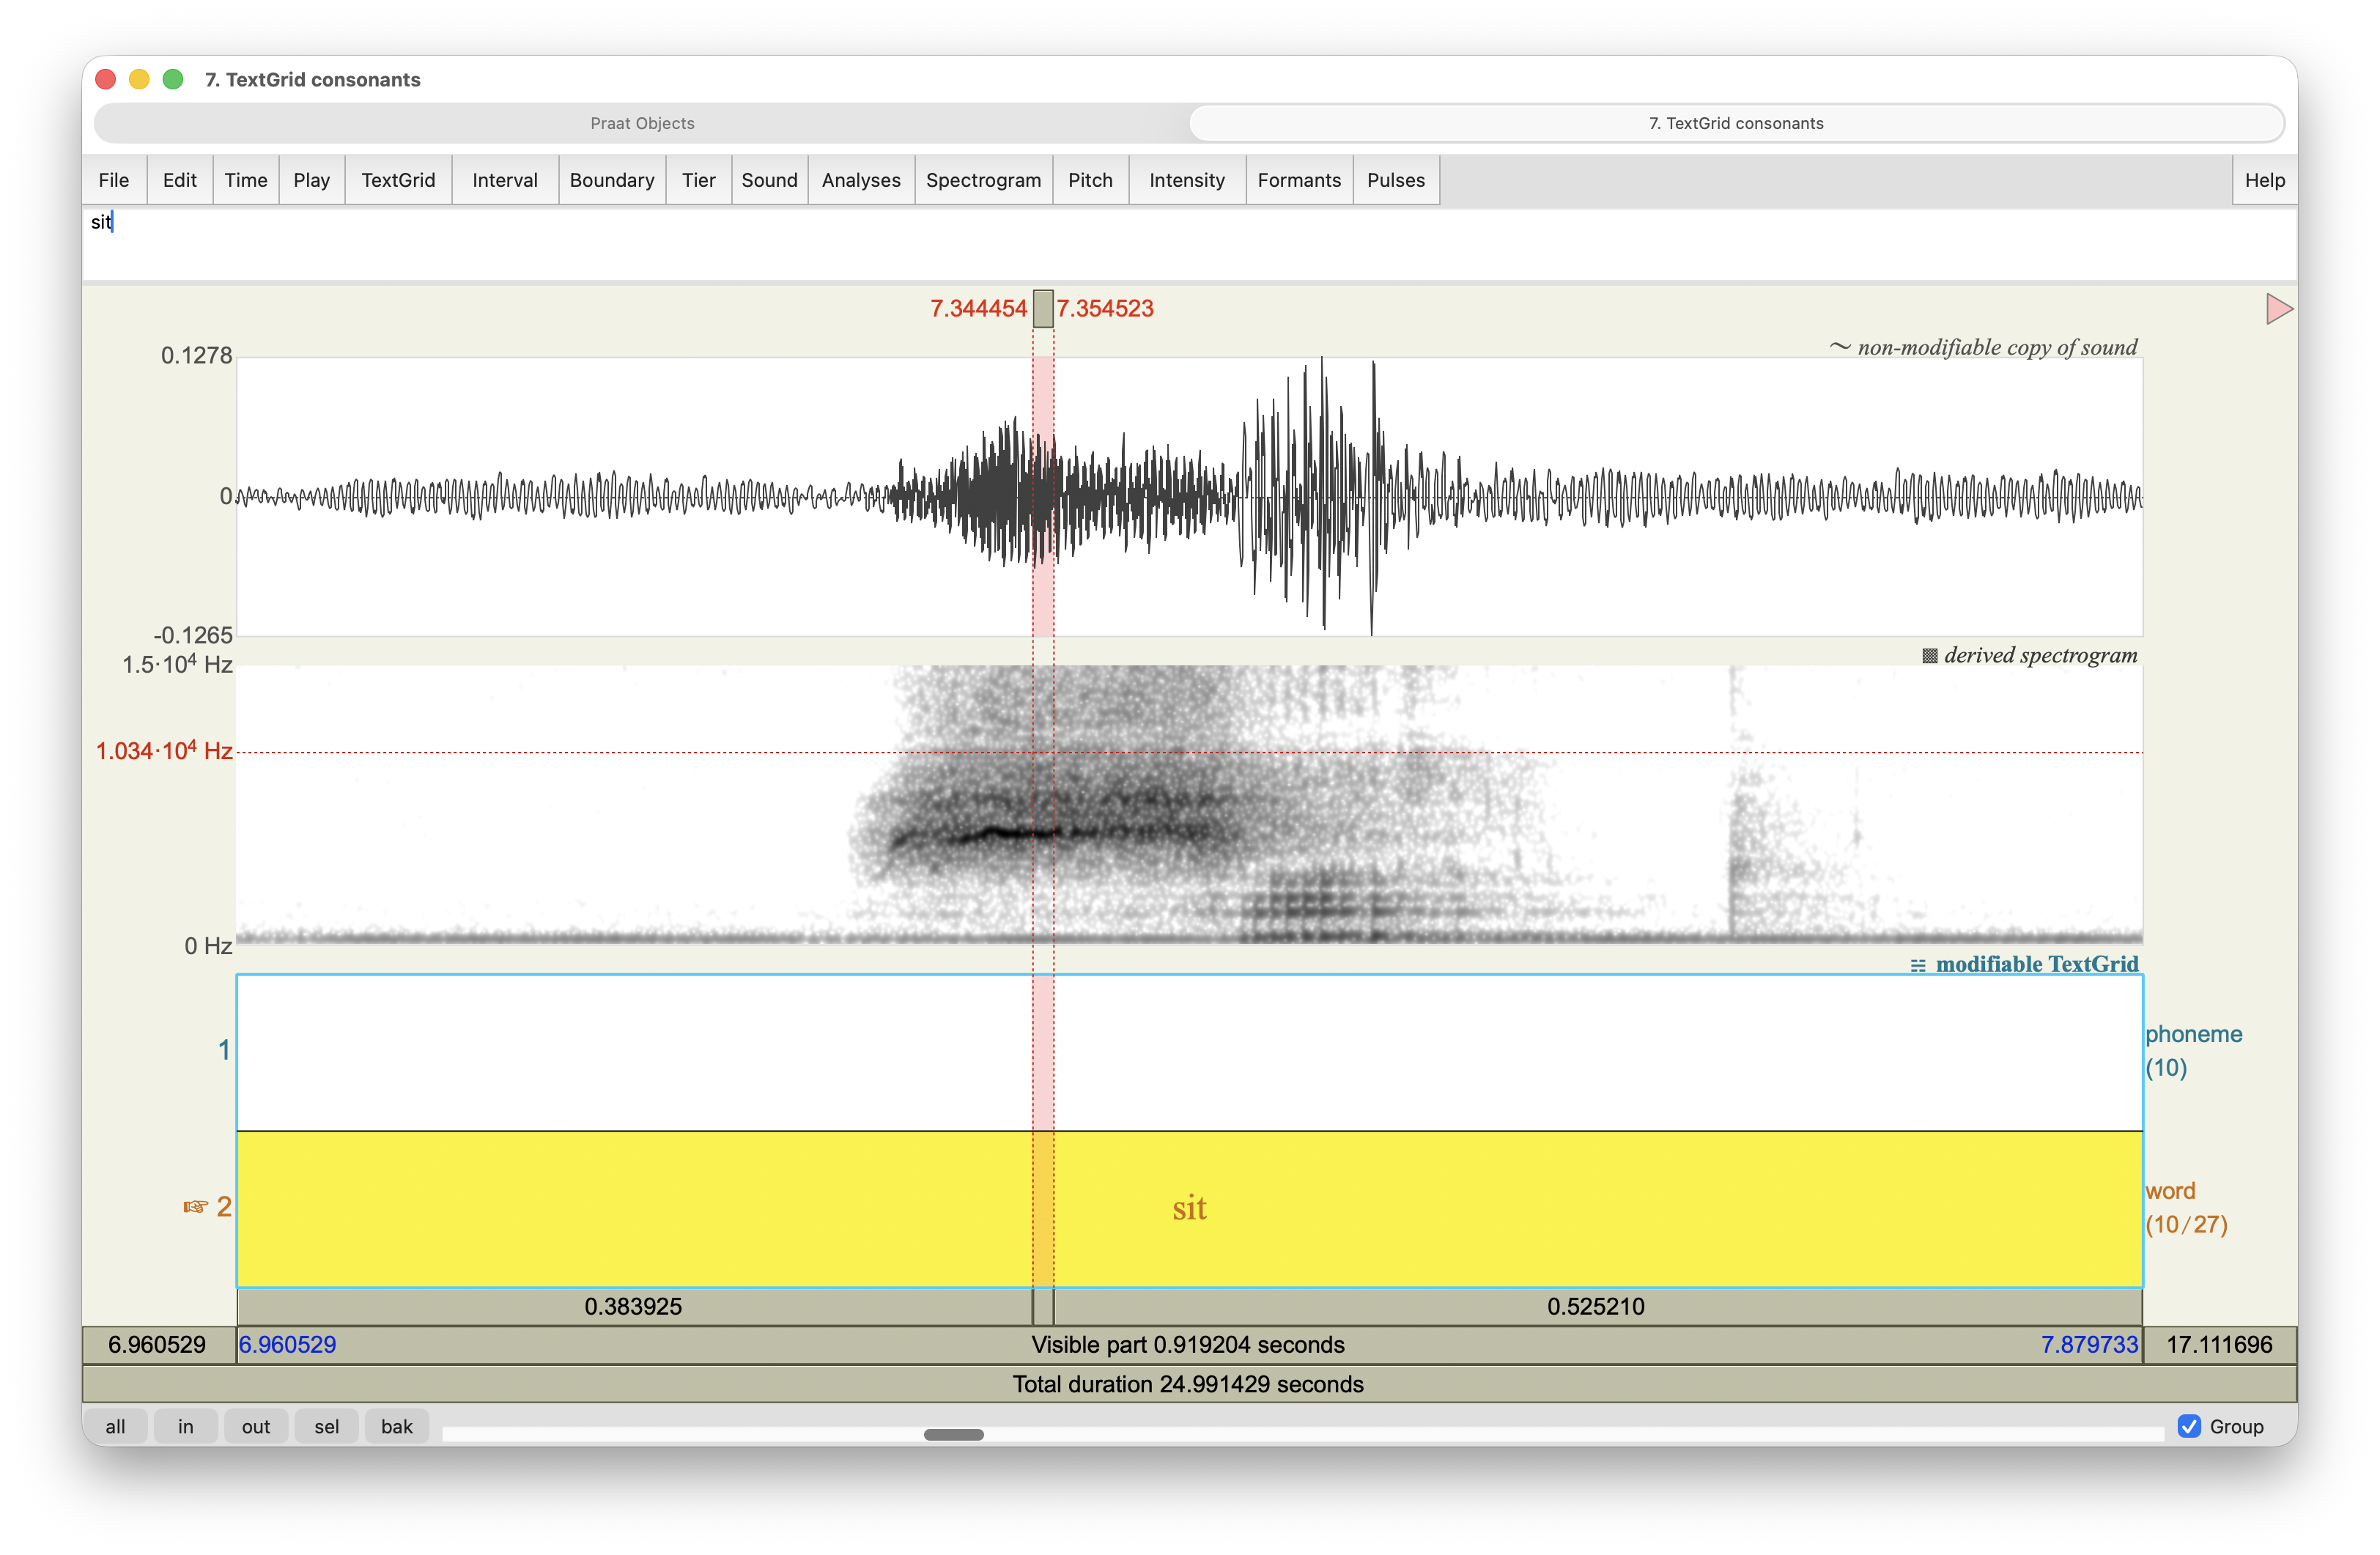
With that little sliver highlighted, go to Spectrogram > View Spectral Slice…. At first it may look like nothing happened. But, what Praat actually did was create a brand new object. Go back to your Praat Objects window and you should see a new “Spectrum” object there. Here’s what mine looks like
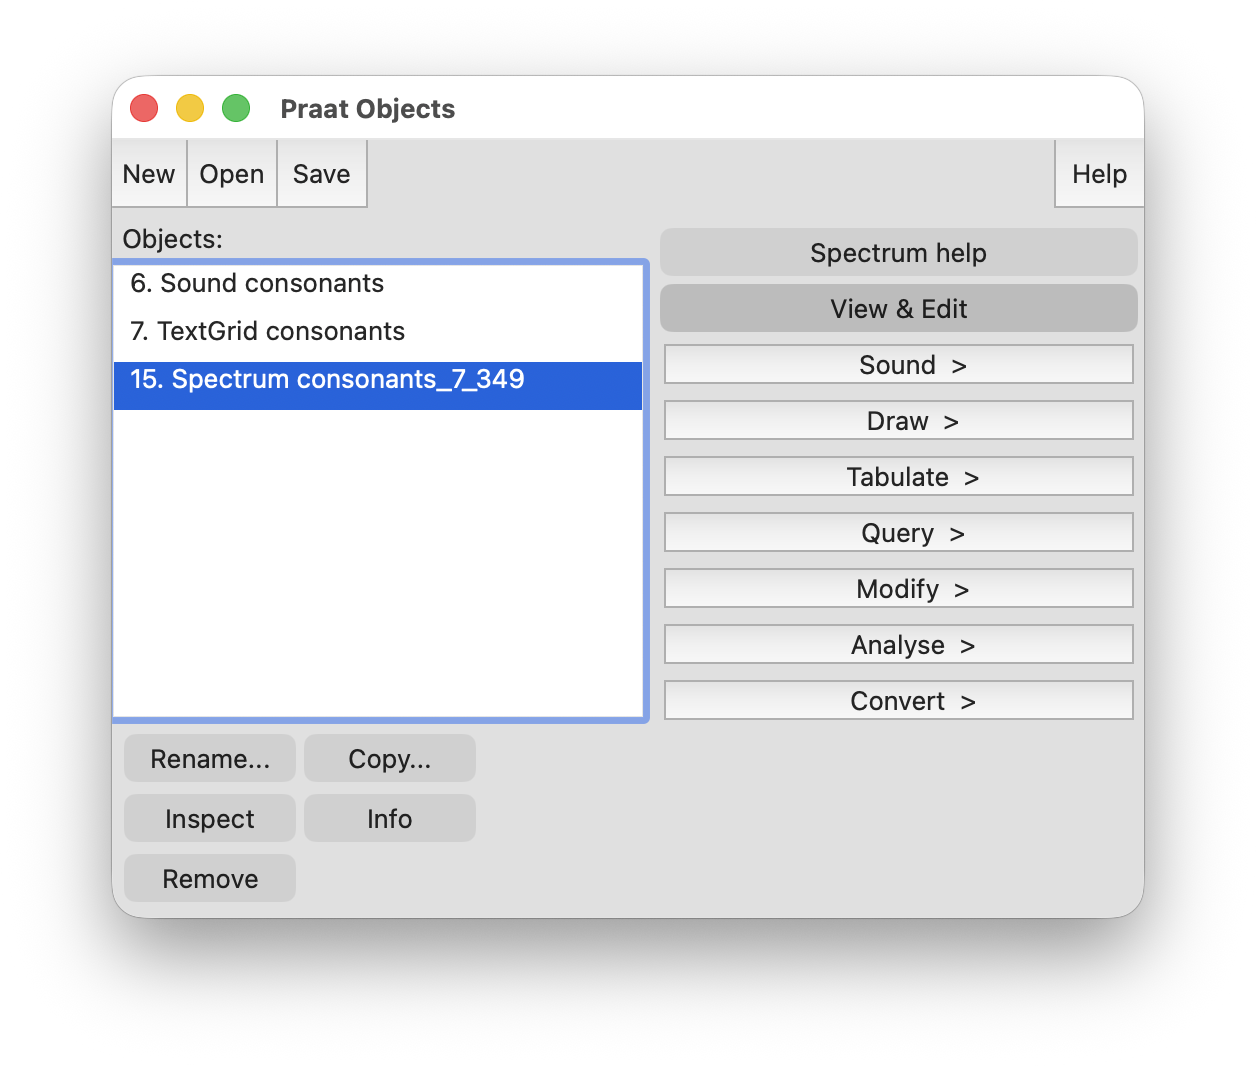
With that new object selected, click on View & Edit. You should see something that looks like Figure 25.
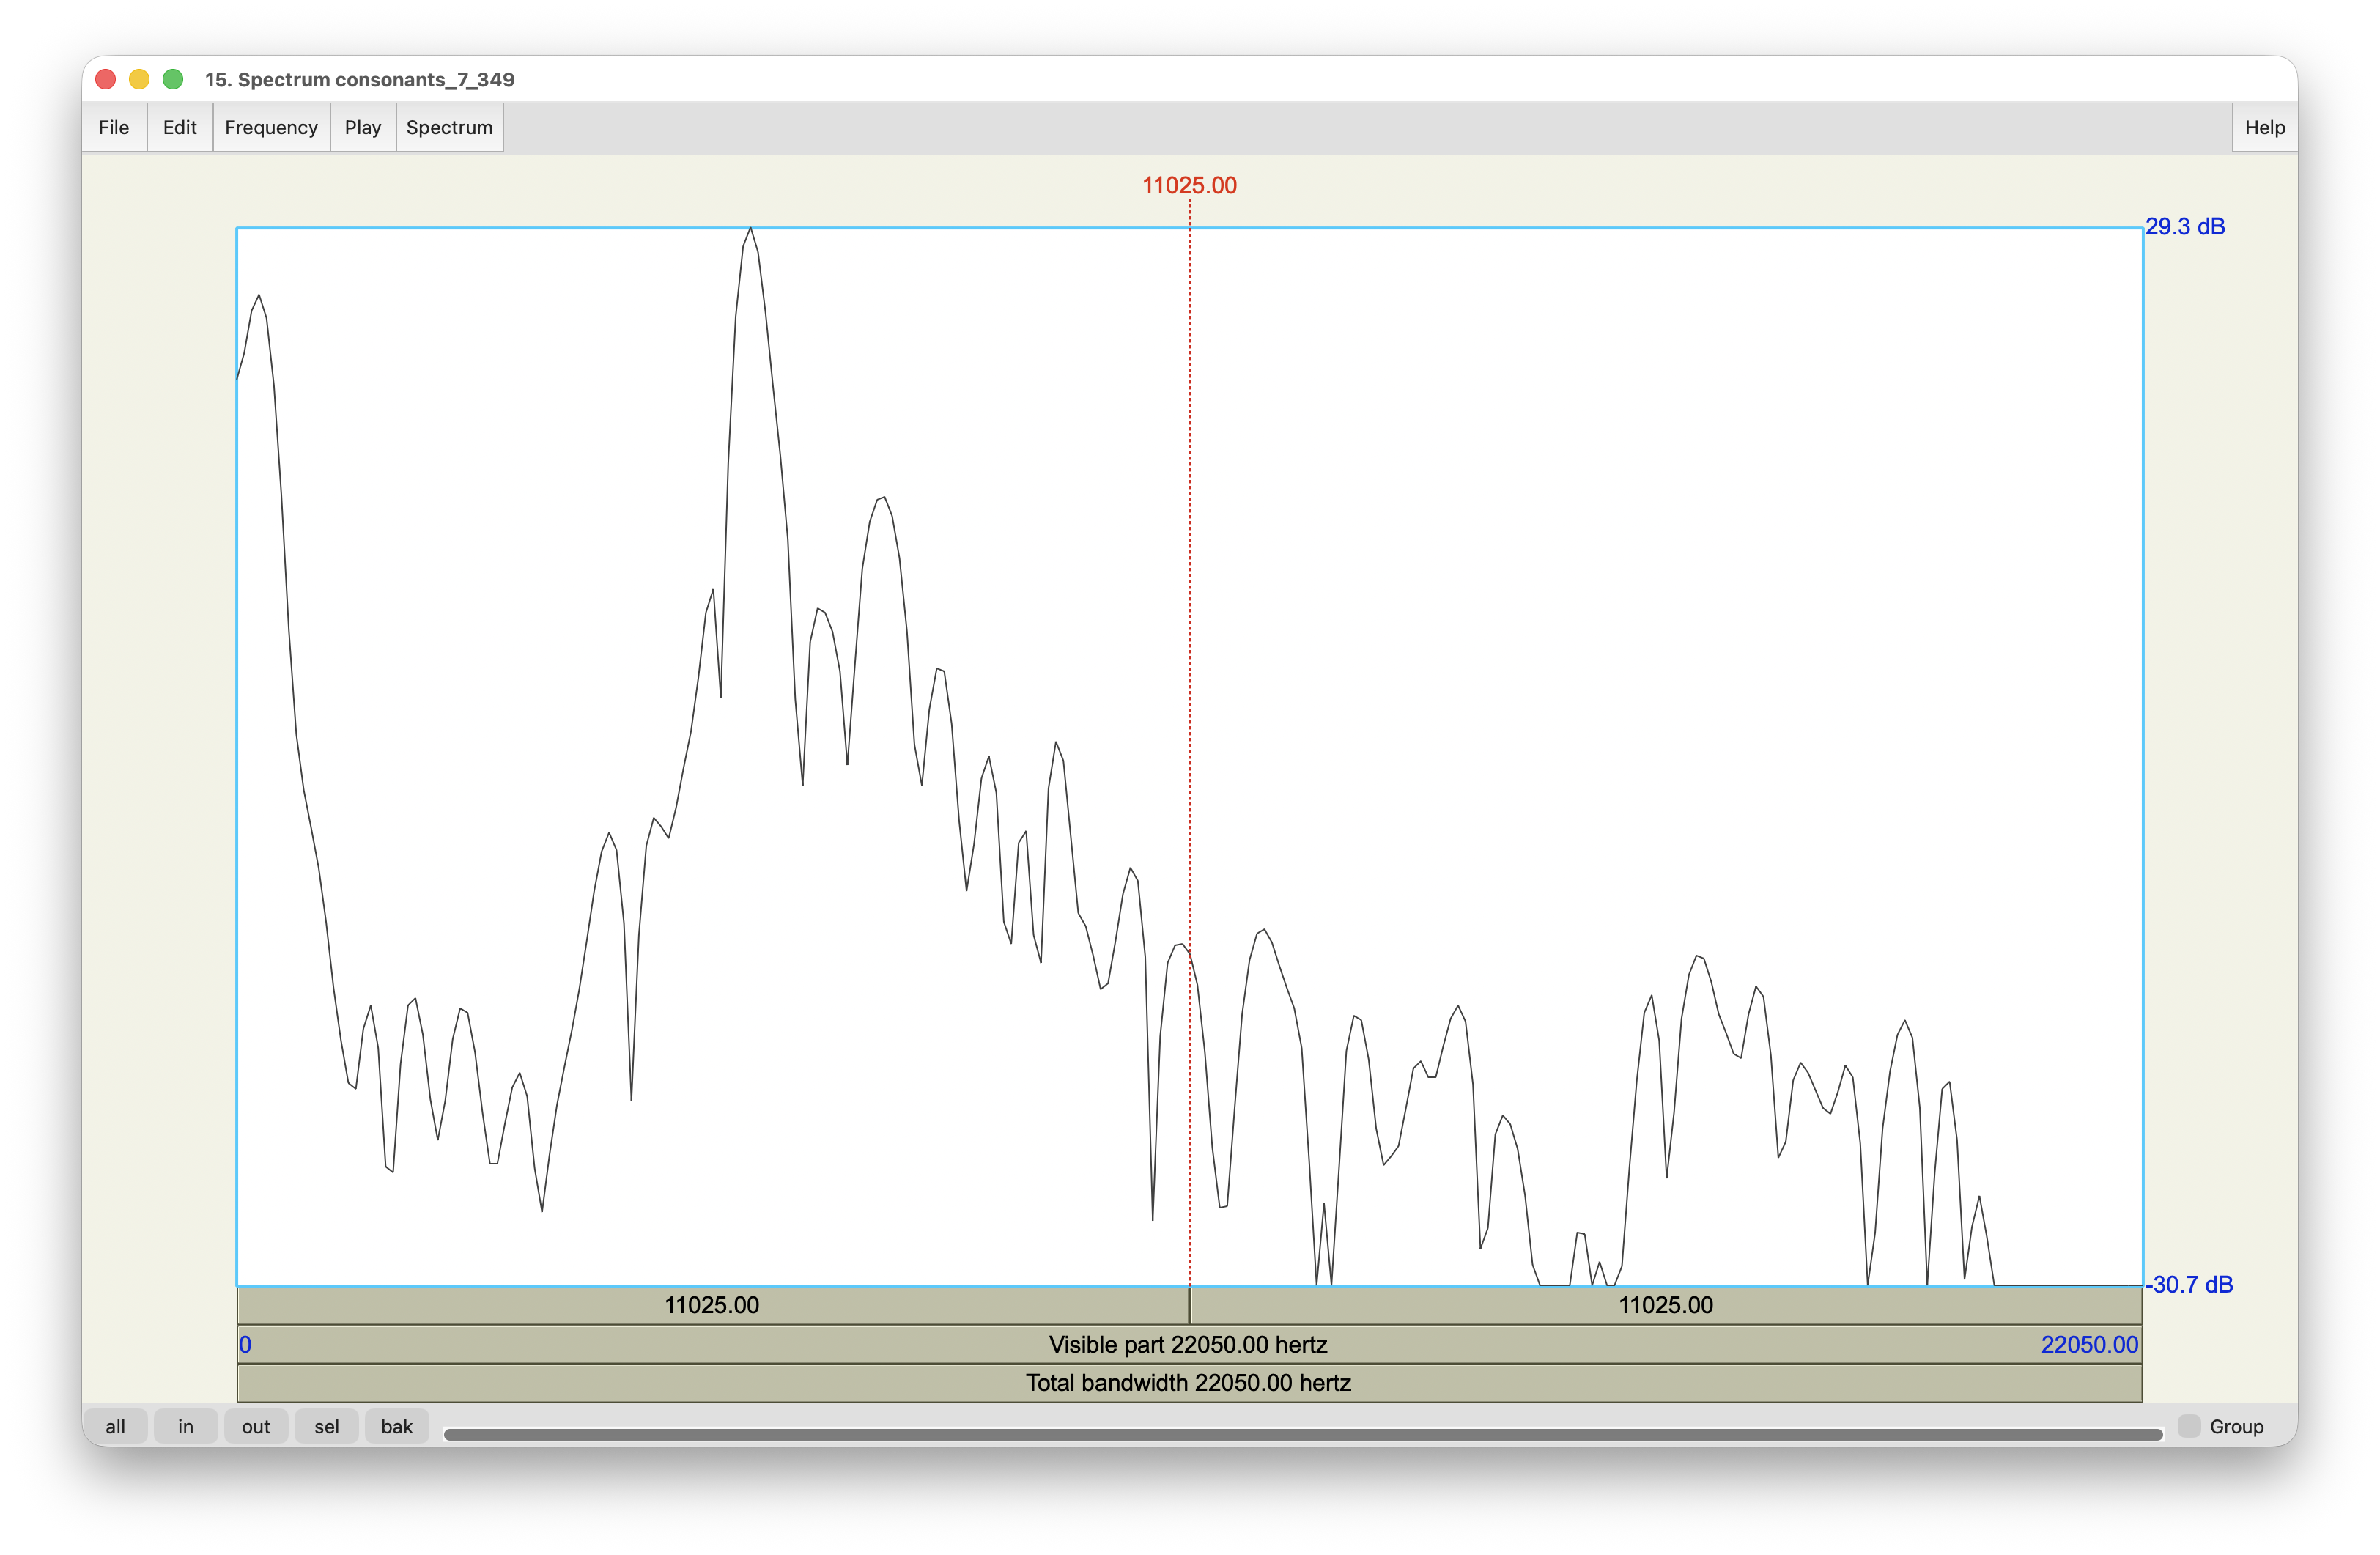
As the name suggests, this is a slice of the spectrogram. In this visualization, the x-axis goes from 0Hz to 22,050 Hz. Along the y-axis now is decibels, a measure of how loud something is. In Figure 25, you can see that there’s more energy—meaning more volume—in the 4,000–12,000Hz range, pretty close to what we saw in the regular spectrogram. (Again, there is also a lot of energy in the 0–500Hz range but that was because I wasn’t in a sound studio.)
What the CoG is is basically a weighted average measurement for this spectral slice. Frequencies with higher energy will factor into the calculation more prominently and frequencies with less energy will influence it less. We can pretty safely guess that the CoG measurement will fall somewhere in that main central zone.
Go back to an instance of /ʃ/, perhaps in the word bash, and view the spectral slice. You should see that much of the energy is shifted towards the left, indicating a lower CoG. This is another visual indicator of what we’re hearing.
7.3 Measuring CoG
So, now that we have visual support for what we hear, let’s now finally get numeric support. For some reason, you can’t extract the CoG measurement from the TextGrid window or even from the Spectral Slice window. You actually have to go back to the Praat Objects window to get it.
Now, go back to your Praat Objects window. Select only your Spectrum object and go to Query > Get centre of gravity…. That’ll pull up a small window with a power setting. Just use the default 2.0. Then that’ll give you number in a separate window. In the case of this recording, the CoG for /s/ in sit was 4,281Hz and for /ʃ/ in bash it’s 934Hz. I can tell you now that those are far too low and the bad recording quality is most likely interfering with the measurements. A typical CoG for /s/ is in the vicinity of 6000Hz and for /ʃ/ it might be around 4000Hz.
Summary of use cases
In the previous four sections, we looked at four aspects of speech in Praat: intonation, vowels, voice onset time, and center of gravity. In doing so, we looked at Praat’s Pitch functions and visualization, formant estimation and how to adjust settings, duration measurements and contextual variation in consonants, and center of gravity and spectral slices. That’s a wide range of functions in Praat. There are of course many more things you could look at but hopefully those four give you an idea of the kinds of things Praat can do.
In this final section, I’ll show a few ways that you can edit the sound in Praat. You might already know how to do many of these things using other software, but it may be helpful still to see what Praat can do and how it can be done.
8 Editing sound
You can indeed edit sound in Praat, but to do so, we can’t also have the TextGrid open at the same time. You might have noticed Praat showing the words “~non-modifiable copy of sound” in your TextGrid window. So, you’ll need to close out of the TextGrid window, highlight only the Sound object in the Praat Objects window, and then click on View & Edit. You should now see the words “~modifiable sound” in the window. Let’s indeed start to modify this sound.
8.1 Extracting sound
First, something to know is that you can highlight any bit of sound and extract it, either as a new Praat object or as a new file to your computer. To do so, just highlight a portion of the recording you want to save, and go to Sound > Extract selected sound (time from 0)…. If you jump back over to your Praat Objects window, you should see a new Sound file. If you play it, it’s just the portion that you highlighted. You can then save it and use it for other things if you want. (You can also save a selected portion of sound directly by going to File > Save selected sound as WAV file….)
With that selected sound, you can also cut, copy, and paste it. You can find the commands in the Edit menu item, but you can just use the typical keyboard shortcuts of command/control + X/C/V. While I don’t anticipate too many people needing to copy and paste sounds around, you may find this is quick way to cut unwanted sound, like the beginnings and ends of recordings, noise in the middle of a recording, loud breaths, speech errors, or just general trimming.
However, anytime you any kind of sound manipulation (including extracting sound), you want to be careful with the boundaries. Because of ✨acoustics✨, if you extract a sound and the boundary in the waveform isn’t crossing the zero point (the middle horizontal line) exactly, it’ll create an auditory artifact at the beginning and end of the audio file. You may even hear this as a little click sound and you might see it in the spectrogram as a very brief black vertical bar. Here’s an example of that from careless copy and pasting.
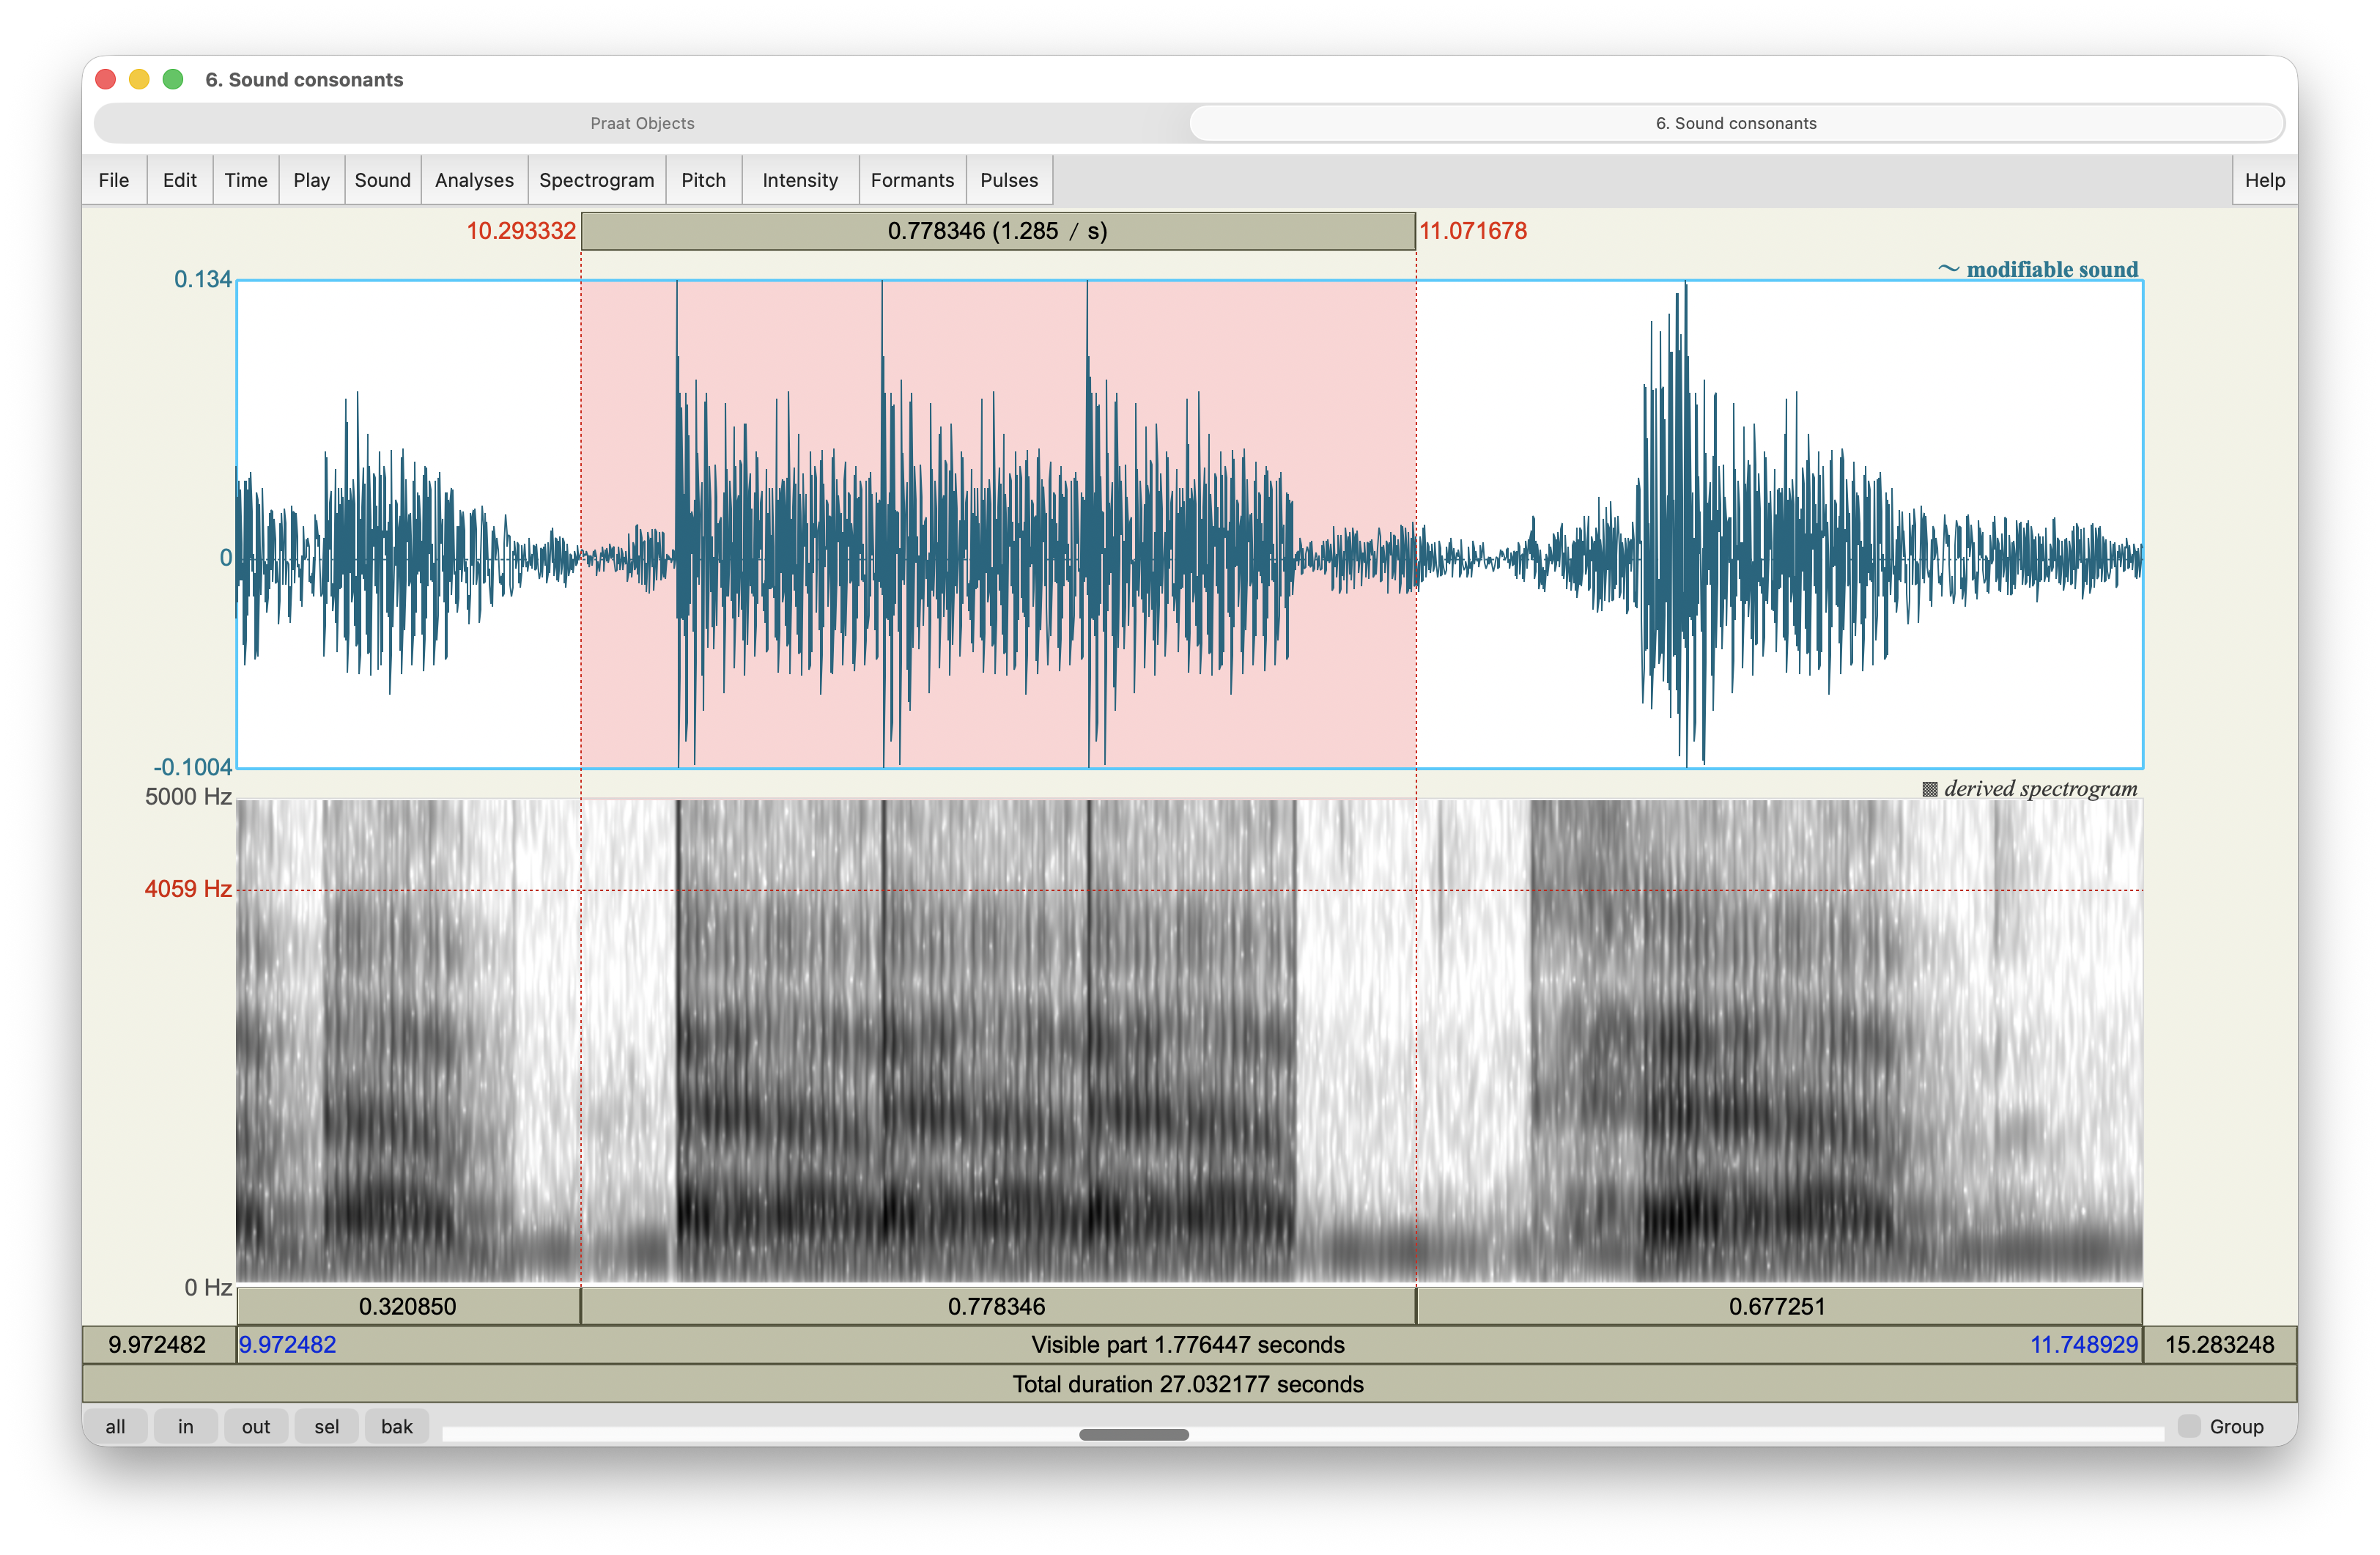
You may think that you can just trim those out with additional cuts, but you might find that they keep reappearing. The reason is a bit complex, but essentially, you’re forcing the sound wave to instantaneously jump from one point to another. If you zoom waaaay in on the spectrogram you might get a feel for what I mean. Sound can’t do that. So it fills in the gaps with a transition, and that little blip is the result of that transition. How can we ensure that the sound wave is at the exact same point when we bring two portions of sound together?
The solution is to make sure that the boundaries of your sound clips are always at the zero crossing. This is easy to do since all sound, regardless of pitch, will cross through that many times per second. Praat can do this for you. Highlight the portion of the recording you want to be the start of your selection. Then go to Sound > Move start of selection to nearest zero crossing and Sound > Move end of selection to nearest zero crossing. You might not notice what these two functions do, but what it did is adjust the boundaries of your selection by a fraction of a second so that they are exactly where the waveform crosses zero. In theory now, if you extract this sound, or cut it out, you’ll avoid those little blips. If you want to paste the sound in somewhere else, just be sure your cursor is at a zero crossing (Move cursor to nearest zero crossing) before doing so.
There are of course many other ways that Praat can digitally modify sound. I encourage you to explore Praat on your own and see what you can find out.
9 Additional resources
If you are interested in learning more about Praat, there are lots of places to learn more. Praat has a user manual both built-in to the software and available online. It is pretty comprehensive though some of the details may not be accessible to all users. If you’d like to read guides written by other people, there are lots of tutorials out there.
- Praat’s website lists several that may be useful. Some are written in languages other than English. Some might be a bit dated, and while Praat has gained new features, there’s very little that these old tutorials show that is not still fully functional today.
- I have written other Praat tutorials. These are hosted here. Some of them overlap a little bit with this workshop. * I have compiled my own list of useful Praat resources. However, this list is older and may be out of date.
I hope this workshop has been helpful. We’ve learned a lot about Praat and have approached acoustic analysis of speech from a variety of angles. I’ve found that the best way to learn is to have an end goal in mind and then learn what it takes to get there. That seems to be easier than just exploring Praat’s many abilities. So, what would you like Praat to be able to do? What should you do next to get yourself to acheive those goals?